Table of Contents
ZENTRA Cloud 2.0 Releases
Release notes for ZENTRA Cloud 2.0
Table of Contents
This article contains a log of release notes for ZENTRA Cloud 2.0.
2026
Sep
Added
Charts & Data Explorer
- Added keyboard navigation and cell selection to the table in Data Explorer table view and the device Table view: select a cell or range and press Ctrl+C to copy it, with a Help button listing the shortcuts. Large tables also scroll noticeably faster.
- Added background data downloads: choose Continue Working while a download is prepared, and a "Your file is ready!" notice appears when it finishes.
- Added an alert status badge to charts and to Data Explorer table view, so you can see at a glance whether a chart has an active alert without opening it.
Alerts & Notifications
- Improved notification groups: per-member SMS and email toggles now sit in the Notification Group dialog, with a prompt to add a phone number if one is missing.
- Improved the alert editor: delta targets show their time span in days and hours instead of raw minutes, and the Enabled/Disabled toggle reads more clearly.
Devices & sensors
- Added a Handhelds tab to the Devices page for all users, so SOLYX Go handheld instrument readings sit alongside your loggers.
- Added the option to transfer a ZENTRA Cloud 1.0 device to ZENTRA Cloud 2.0 directly from the Edit Device dialog.
- Improved the device page map in full-screen view with a Monochrome layer in Light and Dark tones, a combined Measurement selector with port, depth, and position choices, wind direction markers colored by wind speed, a Help button, and faster loading for organizations with many devices.
- Improved reference ET so it uses a device's location override, which means devices without a GPS fix can calculate ET once you assign a location.
- Improved the out-of-level sensor warning on the Devices list with sensor-specific tilt guidance for ATMOS and TEROS sensors.
- Allowed editing a device's configuration, model inputs, and organization while the device is reprocessing data.
Accounts & app
- Added the option to create a new organization from a SOLYX Go handheld serial number. No device password is needed, and the handheld is linked to the new organization.
- Expanded Organization Logs to record notification group changes and accepted invite links, each as a readable entry naming the member involved.
- Improved search so the Devices, Data Explorer, Streams, Dashboards, Alerts, Archive, and Members lists each remember your search for the rest of your browser session. Data Explorer search is also faster.
- Improved ZENTRA Cloud on mobile: list headers scroll away, a scroll-to-top button appears, and Alerts page cards show more information.
- Improved the installed app so it opens to the project you used last, and its icon now fills to the edge without a border.
API
- Expanded the v5 API device data endpoint with
aggregate=hourlyandaggregate=daily. Each returns one row per sensor per bin, aligned to the device's local time, with the row'sstat(e.g.sum,mean,max) and the bin time zone inmetadata.timezone. - Added a gapless per-device
reading_idto every raw value in the v5 API: passsince_reading_idto fetch only readings you haven't seen yet, continue withpagination.next_reading_idornext_url, and checkmetadata.reading_id_max_availablefor the newest id. - Added a top-level
sensor_errorslist to v5 device data. It reports current slow-moving sensor faults, such as Refill Required, per port, and each fault is described inerror_codes. - Expanded the v5 API's sensor error reporting:
error_codesnow describes everyerror_codepresent in the response, any non-zero code is treated as an error, and error-coded aggregate values are converted to the requested units. - Expanded the v5 API device list:
expand=portsnow includes each port'ssensor_serial_numberandsensor_firmware_version(plusrh_daughtercard_serialfor ATMOS 41, 41W, 51, and 14), andexpand=locationreturns each device's latitude, longitude, and elevation. - Expanded the v5 API device data response: each value carries a signed
positionfor multi-depth sensors (negative below ground, positive above), andmetadata.elevationreports the device's elevation in the requested units. - Improved v5 API values so each is rounded to the same precision as the ZENTRA Cloud app and in-app downloads, with unitless measurements (indices, counts, ratios) reporting an empty-string unit.
- Improved v5 API rate-limit responses:
429replies now include a standardRetry-Afterheader, so retry libraries back off automatically.
Integrations
- Added ZENTRA Cloud for Google Sheets™, an add-on on the Google Workspace™ Marketplace that pulls your device readings into a spreadsheet with no code. You paste your API token once, pick devices by name, and each device lands in its own tab. Refreshes fetch only new readings, hourly or daily scheduled refresh keeps the sheet current without opening it, and a Status tab shows when data last updated and why a refresh failed.
Fixed
Charts & Data Explorer
- Fixed chart statistics tiles: weekly tiles now span Monday to Sunday, weekly and monthly tiles are no longer labeled a day early, and daily Sum tiles and relative date ranges follow your organization's time zone. The date picker also shows which time zone its times use.
- Fixed daily, weekly, and monthly aggregation around daylight saving time transitions, which could misalign or drop bins.
- Fixed charts showing stale data after you returned to them, tooltips sticking on shared charts, and a brief "No Data" or "Select Add Data" message appearing while a chart loaded.
- Fixed the Wind Speed & Direction chart flipping directions and mishandling missing values, and the data gap stat card showing the wrong date.
- Fixed a brand-new chart offering Auto-save before its first save; it now shows Save.
- Fixed adding a data stream to a brand-new chart, and fixed re-adding a stream that had previously been removed from a chart.
- Fixed "last N days" and "all data" chart ranges being overridden by stale start and end dates.
- Fixed the mobile dashboard using the wrong date range for its period selection.
- Fixed cloning a dashboard failing for some projects.
Alerts & Notifications
- Fixed delta ("change by") targets and alerts converting temperature changes as absolute temperatures (e.g. a 10 °C change now shows as 18 °F, not 50 °F).
- Fixed SMS opt-in status not refreshing right after phone verification or a profile save.
Devices & sensors
- Fixed ZL6 readings being lost when a logger sent several readings in one transmission, as happens when it catches up on a backlog.
- Fixed device data reprocessing sitting in the queue for long periods, leaving gaps after long reprocesses, or dropping new readings that arrived while it ran.
- Fixed the Devices page Error filter missing sensor faults, and the Good filter matching every device.
- Fixed an error when clearing a port's depth or height setting.
- Fixed the Switch device to ZC2 action failing in device configuration.
- Fixed Water Level and Height/Depth units being saved together; each is now kept independently in the Units settings.
- Fixed the Edit Folder dialog nesting locations under "None".
- Fixed a blank page when choosing Create New in the Add To Workspace dialog.
Accounts & app
- Fixed the welcome page flashing briefly before an organization finished loading.
- Fixed users without an organization being unable to open their profile.
- Fixed an empty actions menu showing for viewers on the Members page.
- Fixed raw formatting tags showing in the Trial Details popup.
- Fixed a tooltip that covered menu options so they could not be clicked.
- Fixed an error shown when a request failed with an unexpected response shape.
API
- Fixed the v5 API's default 14-day range (used when a request omits start and end times) sometimes being anchored to an earlier time instead of the time of your request.
- Fixed unrecognized sensor codes causing a v5 request to fail; they are now reported as
error_code137 (Invalid Value). - Fixed Signal Strength reporting a different port number in the v5 API than in the CSV download.
- Fixed v5 cursor paging so
pagination.num_readingscounts the readings actually returned, andfirst_measurementnever reports a time older than your data retention window.
Aug
Added
- Added Organization Logs, a new page under Setup > Audit Logs that records who changed what in your organization — devices added, removed, or shared to a workspace; members invited and roles changed; alerts, dashboards, data streams, and targets created and edited; and invite links issued — with a workspace filter and entries that name the member and the item involved.
- Added SMS alert notifications. Verify a mobile number on your Profile and accept the SMS consent notice, and you can then turn SMS on per member in a notification group alongside email.
- Expanded the v5 API device list: GET /v5/devices now accepts expand=ports for per-port configuration (sensor, position, and soil calibration), and takes a units parameter.
- Expanded the v5 API device data endpoint with a relative window parameter — for example window=24h for the last 24 hours, up to 365d — as an alternative to explicit start and end times.
- Improved device search so a search term now matches a device's folder name as well as its name and serial number.
- Localized chart action menus and wind direction labels, so they now appear in your selected language.
Fixed
Charts & Data Explorer
- Fixed a chart crash when a data stream's measurement was missing from your organization's measurement list, including growing degree day and growing degree hour streams in organizations set to Fahrenheit.
- Fixed chart values always being rounded to two decimal places; values are now rounded to a precision that suits their size.
- Fixed a measurement disappearing from a chart after a trace color change, which could also discard other unsaved edits.
- Fixed chart axes being dropped when one of the chart's data streams had no data at the selected aggregation period.
- Fixed precipitation accumulation being converted from base units twice, which reported the wrong totals.
- Fixed Data Explorer showing an email address instead of a name for who last edited a chart.
- Fixed the chart actions menu, including Download, being hidden from members with the User role.
- Fixed the data streams filter staying open after you navigated away from it.
Alerts & Notifications
- Fixed a crash when editing an alert before its data streams had finished loading, and a failure when editing alerts from the device view.
- Fixed disabled alerts still sending notifications.
- Fixed battery readings in alerts being taken from the wrong port, so low-battery alerts now report the device's actual battery level.
Devices & sensors
- Fixed sensor error codes not appearing at all on devices running older firmware; fast-moving sensor errors are now reported regardless of firmware version.
- Fixed the sensor install depth being truncated, so the depth you entered is the depth returned.
- Fixed reference ET being stored as 0.0 mm when an upload contained a single record.
- Fixed uploaded readings older than a day going missing from charts and downloads.
Accounts & organizations
- Fixed being unable to remove a pending member — someone invited but not yet signed up — from an organization.
- Fixed the controls on the Units page being disabled even for editors.
API
- Fixed the v5 API counting a request against your rate limit before checking whether you were authorized to make it.
Jul
Added
- Released Table view to all users: any Data Explorer chart or device chart can now be viewed as a sortable data table instead of a graph. Not supported in the dashboard view.
- Added an Email Preferences section to your Profile, where you can choose which product update, incident, and maintenance emails you receive from ZENTRA Cloud.
- Added autosave to Data Explorer, so edits to a chart are kept as you work rather than lost if you navigate away.
- Improved the Data Explorer list with measurement and reference icons and the data types each item contains, so you can identify a chart without opening it.
- Improved notification groups: you can see and change a rule's assigned groups directly from the Alerts list, and create a new group from an alert without leaving the page.
- Improved alert activity so you can tell which data stream triggered each event on charts that watch more than one.
- Added a download button to the Wind Rose chart.
- Added Actual ET as an accumulation trace option in Explorer Statistics.
- Added a create-new-dashboard button to the dashboard view, so you can start a dashboard without returning to the list.
- Added click-to-toggle autoscale on chart axis inputs — select the axis value to switch between automatic and manual scaling.
- Improved sorting throughout the Devices list: device names, serial numbers, and folder and location names now sort case-insensitively.
- Expanded the v5 API: consumers can now list devices including metadata, device settings, and organization name, page through data pulls using `next_url`, and pass `expand` as a comma-separated list.
- Added zentraR, an R client for the v5 API. It pulls device lists and readings directly into tibbles, syncs several devices in parallel, paces itself against the rate limit, and can keep a local store up to date on a schedule. Install it with `remotes::install_gitlab("meter-group-inc/pubpackages/zentraR")`. View in GitLab.
- Added `zentracloud`, a Python client for the v5 API that handles authentication, pagination, rate-limit pacing, and response parsing, and returns fully typed objects. Install it with `pip install zentracloud`. View in GitLab.
Fixed
Charts & Data Explorer
- Fixed a crash when opening the statistics table.
- Fixed chart data dropping readings on charts that combine several data streams.
- Fixed the aggregation period used when reading data points, so aggregated values now match the period you selected.
- Fixed the date range picker so the end time defaults to the end of the selected day, and corrected a regression in the short date labels on the picker button.
- Fixed folder filtering on the Devices and Streams lists.
- Fixed filters being reset during the create-datastream flow; your filters now carry over.
- Fixed the add-data popup so it closes when you finish adding data streams to a chart.
Devices & sensors
- Improved handling of tilt and orientation errors on weather sensors: sensor error codes now read more cleanly.
- Fixed ATMOS 51 diagnostic codes appearing when the sensor is reporting normally.
- Fixed older device logs being ignored, so late-arriving logs now appear in device history.
- Fixed the search field on the device logs view.
Alerts & Notifications
- Fixed alert emails showing timestamps in the wrong time zone.
- Fixed alert editing incorrectly reporting unsaved changes after a notification group was deleted.
Accounts & permissions
- Fixed the organization name field so it is clearly marked as required when creating an organization.
- Fixed error messages when claiming a device while creating your first organization, and made the create-organization success message consistent everywhere it appears.
- Fixed Viewers being offered actions they cannot complete: restoring an archived device, and saving unit changes.
Jun
Added
- Added forward and backward navigation to Data Explorer graphs, letting you step through time by the span you currently have selected (e.g. select 7 days, then move forward or back a week at a time).
- Improved the Alerts list with alert groups, current alerting status, and the chart name behind each rule, so you can see what is triggering at a glance.
- Improved data downloads: charts, data streams, devices, and surfaces now share the same download dialog with consistent options.
- Improved measurement visibility: a measurement hidden for a sensor now stays hidden everywhere — Data Explorer, the Streams page, device charts, and sensor outputs.
- Improved loading speed of the Data Explorer list.
- Connected an automated welcome email for new ZENTRA Cloud accounts.
Fixed
Alerts & Notifications
- Fixed an issue where creating a chart alert failed because a target could not be added.
- Fixed the Alert Events chart so it renders event history correctly.
- Fixed the Device alerts view to show a clear empty state when no device is selected.
- Fixed alert status and last-notified timestamps so ongoing alert conditions update reliably and notifications are not duplicated or missed.
- Fixed the notification group selector so pending members no longer appear as assignable recipients.
- Fixed being unable to unassign a group from an alert.
- Fixed being unable to uncheck email notifications when subscribing to an alert.
Charts & Data Explorer
- Fixed an app crash triggered by selecting a device with wind speed measurements, and related crashes on charts with undefined axes such as wind direction.
- Fixed chart data not displaying after saving changes without a page refresh, including charts not updating after adding a data stream from the Streams page.
- Fixed an empty chart lightbox when opened from a dashboard.
- Fixed an error in the chart date picker when the selected range extended past the available data.
- Fixed charts rejecting data timestamps slightly ahead of the current time, which could leave the most recent reading off the graph.
- Fixed an issue where a chart with a pF axis could not be saved.
- Fixed chart cloning failures.
- Fixed a delay when updating a chart's name.
Data downloads
- Fixed field quoting in exported data files so values containing commas or quotes import correctly into spreadsheets.
- Fixed an internal error when downloading chart data, and incomplete results when downloading aggregated data streams.
Devices & Sensors
- Fixed the upload count and upload data display on the device page so daily upload totals are accurate.
- Fixed the log filter on the device view page.
- Fixed water content missing from the Devices list.
- Fixed an issue where setting calibration on a sensor that also has an elevation value failed.
- Fixed reference ET values being attributed to the wrong model output.
- Fixed a check that incorrectly treated some editable devices as read-only.
API
- Improved enforcement of Viewer access restrictions on the v5 API.
May
12 - 31
Added:
- The Integrations page under the user account is now available to all users. View and copy your API Token ID.
- The updated ZENTRA Cloud 2.0 status page allows users to subscribe to uptime status notifications.
- Updated terminology across the platform - "Projects" are now called Workspaces.
- ETo is now the default model variant when creating a custom evapotranspiration (ET) model.
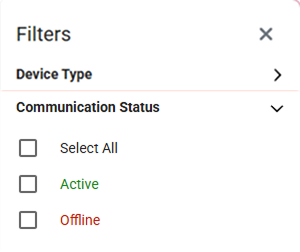
- Added the ability to filter the device list by communication status: Active or Offline.
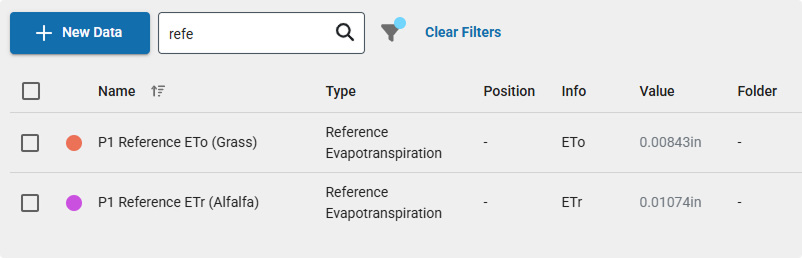
- The Datastreams table now includes model type or model variant information in the Info column.
Fixed:
- Prevented devices from being moved between organizations while data reprocessing is in progress. The option is now disabled during reprocessing to avoid errors.
- Fixed an issue where deleting a project did not refresh the page.
- Resolved an error that could occur when deleting an organization.
- Fixed a delay where updates to a device’s folder were not immediately reflected in the UI.
- Resolved an issue where adding a device could fail if no location was specified.
- Removed serial number case sensitivity in the v5 API. Previously, ATMOS 41W required uppercase, and ZL6 required lowercase.
- Fixed a layout issue on mobile where the logs view was offset off-screen.
- Prevented folder names from being created with only whitespace or trailing spaces.
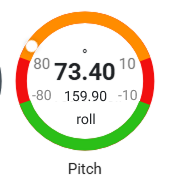
- Updated pitch and roll labels on the gauge element for better clarity.
- Fixed an issue where clearing the data stream type did not clear the input field when selecting “x”.
- Resolved download failures for custom graphs and devices containing evapotranspiration measurements.
- Fixed UI overlap between the filter panel and the device “more” menu.
- Removed erroneous message shown after creating a new Workspace.
- Users with pending invites can no longer be added to notification groups.
- Updated messaging clarifies that invited users won’t receive notifications until they accept.
- Fixed charts exceeding bounds (upstream fix from chart provider applied).
1 - 11
Added:
- The Explorer chart now defaults to the currently selected period when opening the download modal.
- ETo (grass reference) model data columns in downloads are now ordered after standard measurements and before system fields (e.g., battery, signal).
- Added the ability to enable or disable device-related alerts without requiring deletion.
Fixed:
- Fixed an issue where elevation overrides were not updating correctly in the frontend UI.
- Resolved a bug causing TEROS 06 depth metadata to not display alongside measurement traces.
- Prevented the creation of unnamed folders, which could not previously be assigned or edited.
- Corrected datetime formatting in API responses to use T for strict ISO 8601 compliance.
- Fixed an issue preventing dashboards from being renamed.
- Resolved a bug where low battery alerts showed no corresponding event activity in charts.
- Fixed a crash that could occur when updating axis colors in custom graphs.
- Fixed an issue where clearing the search field in Notification Groups removed previously added members.
- Resolved an error that occurred when project editors attempted to view custom charts.
- Corrected communication status for Wi-Fi devices.
- Fixed an application crash when navigating to the last device in long device lists.
- Resolved inconsistencies between accumulated solar radiation values and table sums.
- Fixed missing data columns in TEROS 54 downloads.
Apr
14 - 30
Added:
Evapotranspiration (ETo Grass) Auto-Model
- Added an ETo (Grass) auto-model for ATMOS 41 / 41W weather station sensors. This model output is now included by default in:
- Datastreams
- Device data downloads
- API responses
Email Alerting for Targets
- Introduced email-based alerting for targets with support for:
- Target ranges and threshold-based alerts
- Notification groups for managing alert recipients
- Two configurable alert types:
- Chart-based alerts
- Device battery monitoring alerts
- Customizable battery alert thresholds via a slider control
Fixed:
- Fixed an issue where sorting devices by status did not work correctly.
- Resolved an issue where the precipitation table was not displaying on the default charts view.
- Improved error handling so downloads requested with no available data now return a more specific and helpful error message.
- Fixed an organization timezone issue that could cause page crashes.
- Improved the mobile measurement selector:
- Now displays the currently selected parameters
- Fixed the modal so selected parameters persist and display correctly when re-opened
1 - 13
Device Logs
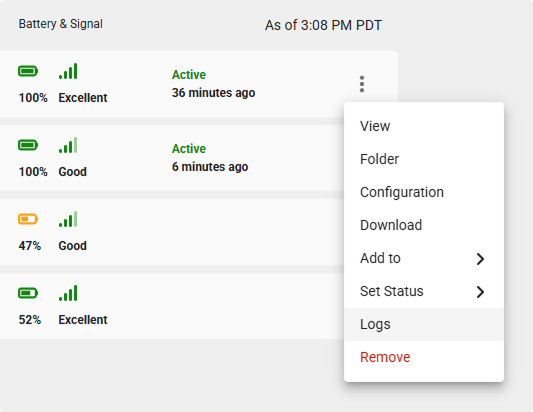
- Added the ability to view device-level logs for supported devices (e.g., ZL6, ATMOS 41W) to help with troubleshooting and monitoring device performance.
- Logs capture device activity, data uploads, errors, and configuration changes, providing better visibility into device behavior over time.
- Logs can be searched, filtered, and downloaded to support diagnostics and offline analysis.
- Device Logs are accessible from the more menu on the device.
Pitch & Role
- Added a Pitch Gauge for the tensiometer (e.g., TEROS 32).
Fixed:
Models
- Fixed an issue where updating the input for models such as GDD would fail.
Filters
- Fixed an issue where searching for a device name in filters returned no results.
- Added a filter option to the Create New Datastream flow. Selected filters now persist when navigating between pages.
- Updated the filter side panel so it pushes content to the side rather than displaying over it.
- Added support for port and folder in the datastream search field.
Graphs & Downloads
- Fixed an issue where precipitation sum values did not display on default device graphs.
- Fixed a mobile issue where the download period selector was not selectable.
- Fixed an issue where selecting Download on an Explorer graph did not trigger a download.
Devices & Data Management
- Fixed an issue where assigning a device folder to None incorrectly created a folder named “None” instead of clearing the assignment.
- Improved the error message shown when attempting to add a device that is not on the US server when creating your first organization.
Sensors & Measurements
- Corrected an issue where all depths for the TEROS 54 sensor were displayed as 60 cm.
- Addressed an issue where the measurement order was inconsistent between the TEROS 12 and SOLYX 14 sensors.
- Fixed an issue where drainage calculations used an incorrect aggregation method. Aggregation now correctly uses the last value.
Mar
17 - 31
- Imported the latest translation keys to improve language consistency, accuracy, and coverage across the platform.
- Reduced the water content limit for calculating Pore Water EC and Saturation Extract EC from 15% to 5% for SOLYX water content sensors, extending the range of the modeled outputs.
Fixed:
Data Integrity & Migration
- Reprocessed devices with incomplete data imports carried over from ZC 1.0.
- Corrected an issue where custom calibrations were not applied retroactively to existing data.
- Fixed a bug where soil calibration updates did not persist after saving.
Calibration & Sensor Configuration
- Custom calibrations now reliably apply after saving.
- Soil sensor position now correctly defaults to depth, rather than height.
Downloads & File Handling
- Fixed an issue causing All Data downloads to fail when selecting the Excel file format.
- File attachments added during feedback now persist properly even if the user closes the form before submitting.
Projects, Organizations & Visuals
- New organizations now correctly receive the default color palette.
- Additions or edits to project color palettes now save consistently.
- Resolved an issue where deleting a target caused the app to crash.
- The target range delimiter has been updated for improved clarity and user understanding.
- The Save button on custom charts no longer stays active after saving.
- Fixed inconsistencies where organization color palette changes did not persist.
Models & Calculations
- Addressed an issue in the GDD model that occurred when measurement intervals were ≥ 60 minutes.
Authentication & Account Access
- Users can now successfully switch to a different account after logging in with Google.
- Fixed various reliability issues affecting Sign in with Google.
Device Management
- Fixed an issue where an error message incorrectly displayed when adding a device, despite successful device creation.
3 - 16
- Enhanced Organization Naming. Organization names now support the use of parentheses “(” and “)”.
Fixed:
Device & Organization Management
- Fixed an issue where users were unable to clear the search field on the Archive tab.
- Resolved a problem preventing users from saving device moves to a new organization.
- Corrected a bug that caused devices to fail to archive.
- Device configuration pages now correctly reflect the new organization after a device is moved.
- Calibration values no longer display N/A incorrectly in sensor configuration.
- Addressed an issue where ECT/RT‑1 sensor temperature measurements were not properly supported in models.
Projects & Charts
- Fixed various Project-related bugs impacting navigation and configuration.
- Resolved issue where users could not delete a chart with unsaved changes.
- Selecting a parent folder now correctly selects all subfolders.
- Fixed chart behavior where new data did not display until after saving.
- The bar units chart type no longer crashes during chart creation.
- Improved validation and flow for entering negative values in targets.
- Corrected behavior when entering small decimal values (e.g., 0.09) for targets.
- Canceling with unsaved chart changes now properly resets the state.
General UI & Functionality
- The main menu on mobile no longer overlaps UI elements.
- Users can now reliably download device and chart data.
- Custom soil calibration forms can now be saved successfully.
Feb
- Added a feature to clone dashboards.
Fixed:
- Fixed issues with the Wind Rose chart.
- Fixed issues with CSV and Excel downloads.
- Fixed UI flicker on first page load.
- Fixed the password reset linking to the wrong page.
Jan
- Published the v5 API documentation page.
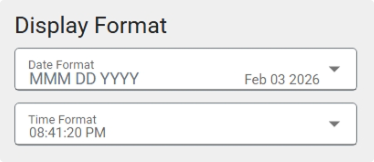
- Added date and time display format options for the organization.
Fixed:
- Fixed ordering issue with wind rose legend.
- Fixed date picker menu closing on mobile.
2025
Dec
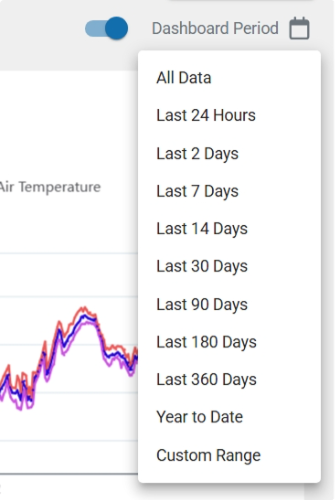
- Added a dashboard date picker so the period for all charts on a dashboard can be synced.
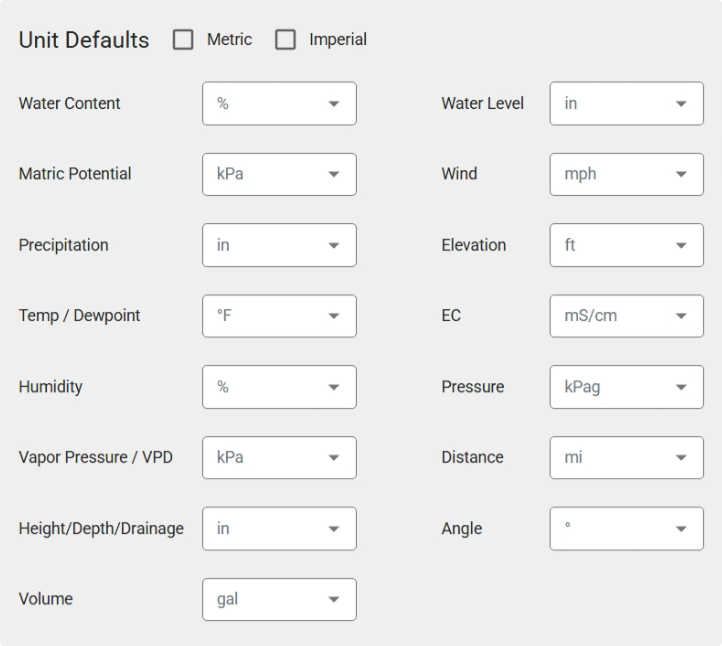
- Added a quick select checkbox for Metric and Imperial units.
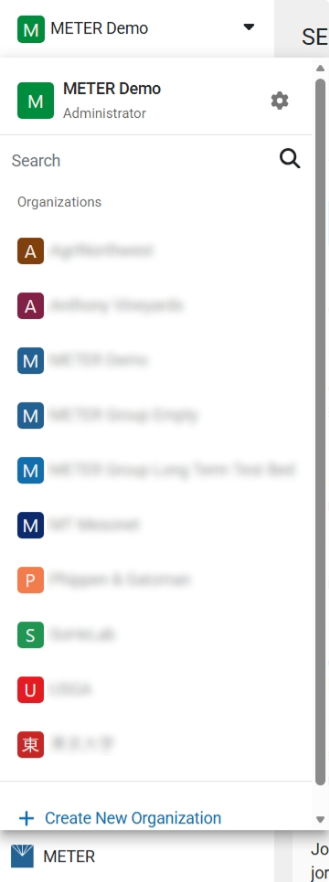
- Updated the organization dropdown with user role, gear icon to settings, and Create New Organization button.
Nov
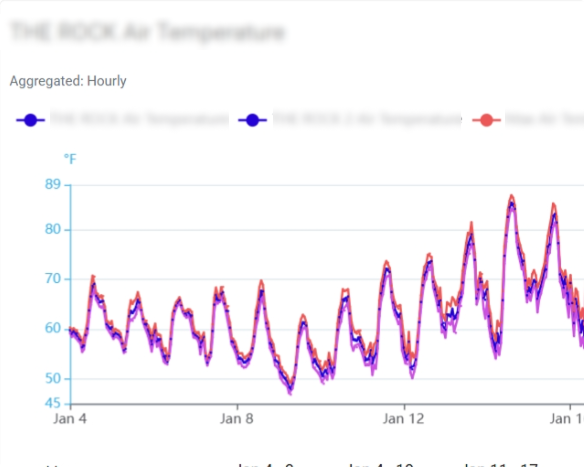
- Added data aggregation info to graphs (Unaggregated, aggregated hourly, etc).
- Newly created targets now auto-add to the current graph in Explorer.
- Support for stitching default data streams added.
Oct
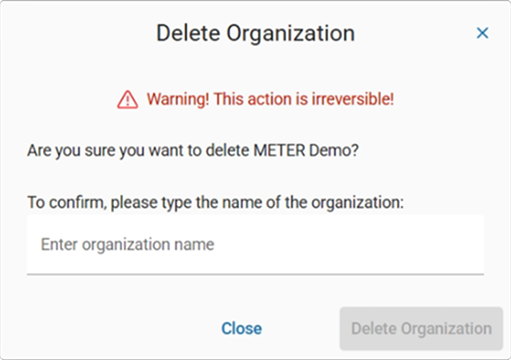
- Added a delete organization option with a field to type the name of the organization to confirm.
- Flattened selection of models by bringing all models to the top-level menu in New Data.
Fixed:
- Updated search for time zone name.
Sep
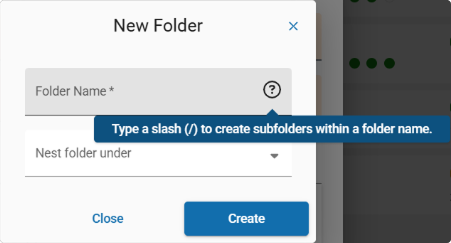
- Use a slash "/" to create subfolders when creating new folders.
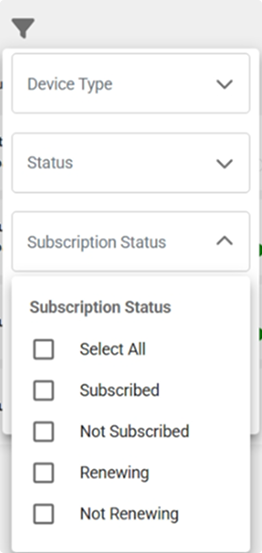
- Added filter for device subscription status.
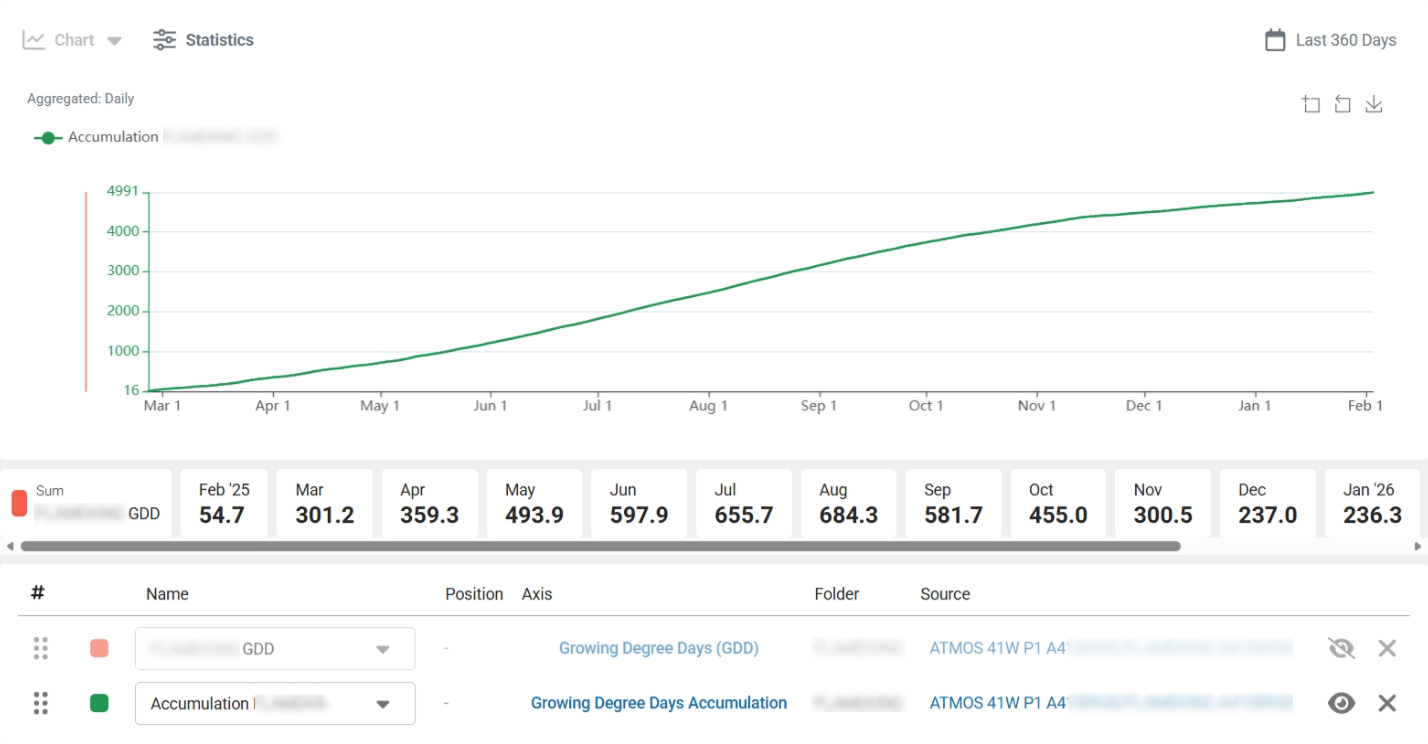
- Added option to temporarily hide plotted data on Explorer.
- Added multi-select on device grid view.
- Added sort device list option for mobile.
Fixed:
- Fixed dashboard sort not working.
- Updated navigation accessibility for keyboards.
Aug
- Device firmware version added to device view.
Jul
- Charts: Disabled spline smoothing on graphs.
- Filters: Filters now persist across sessions.
Jun
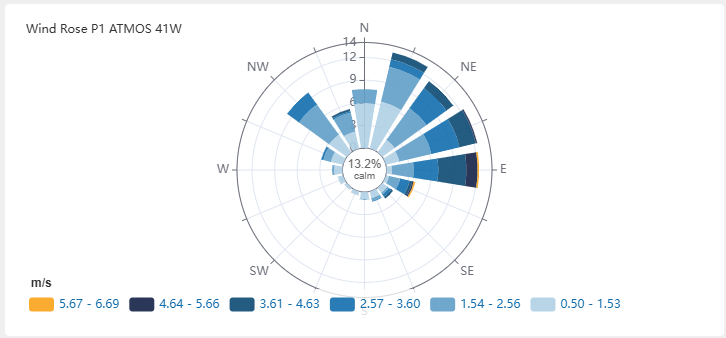
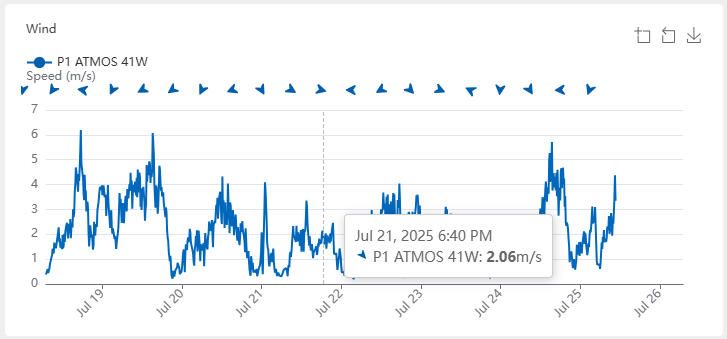
- Device Charts: Added wind rose and wind direction to default device charts.
- Filters: Updated the filter for data streams and improved the performance.
- Fixed:
- Fixed issue with Utah Chill Model.
- Fixed issues with inline statistical metrics.
May
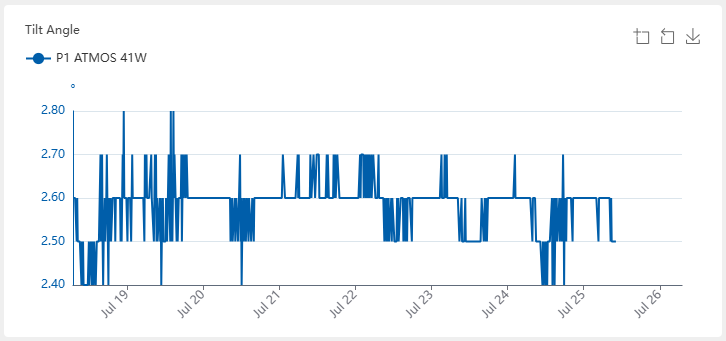
- Device Charts: Added tilt angle to default device charts.
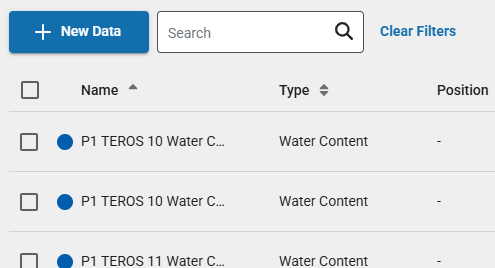
- Data: The "New Data" feature on the data page is now available to all users. Create new data streams, including supported models.
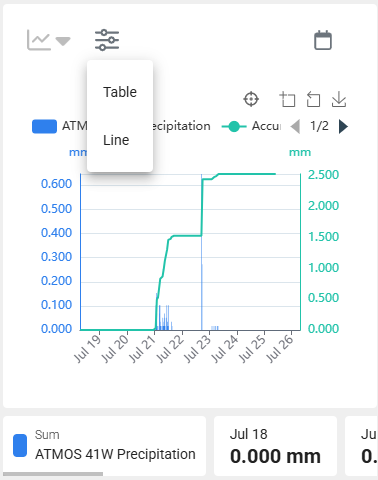
- Explorer Statistics: This feature is now fully released to all users.
- Projects: Devices can now be added to a project from the device more menu.
- Fixed:
- Fixed page crash when selecting PAW as a model.
- Fixed issue with newly created location folders not shown until after page reload.
Apr
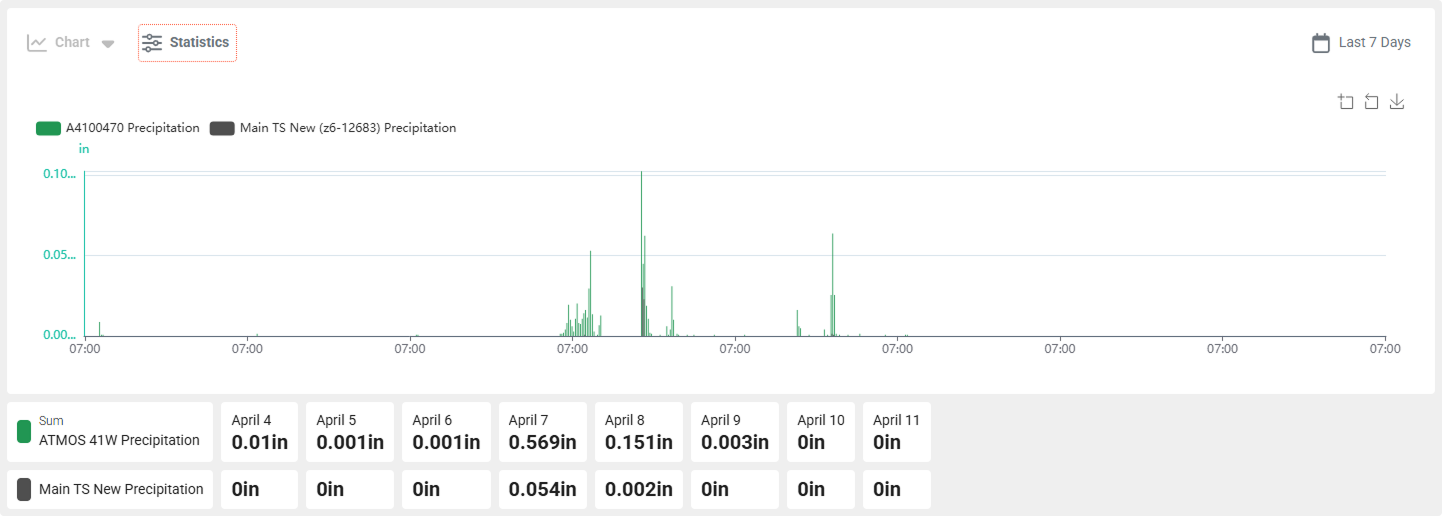
- Statistical Metrics: Custom charts can now include a table and inline stats, providing more detailed insights into your data.
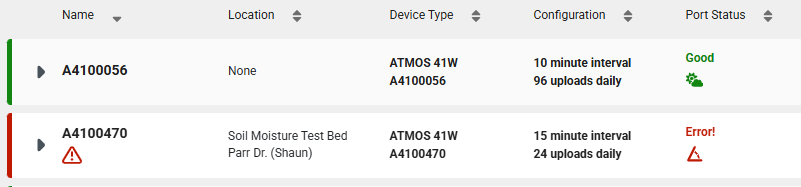
- Port Status: Updated the ATMOS 41W port status to use icons that identify the status.
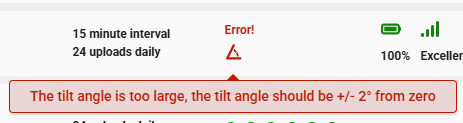
- Charts: Added aggregation data to the chart tooltip.
- Plant Available Water: PAW models can now be edited from the Explorer.
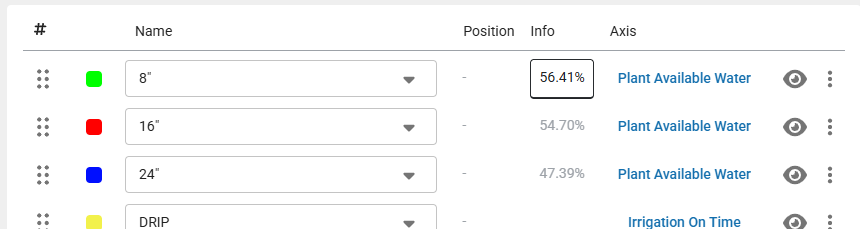
- Projects: This feature is now available to all users.
- Fixed:
- Fixed issue with table stats not displaying the total for precipitation.
- Fixed ATMOS 41 not being listed as available for Daily Light Photoperiod.
Mar
- Bulk Edit Location: You can now edit the folder location for multiple devices at once, streamlining your organizational process.
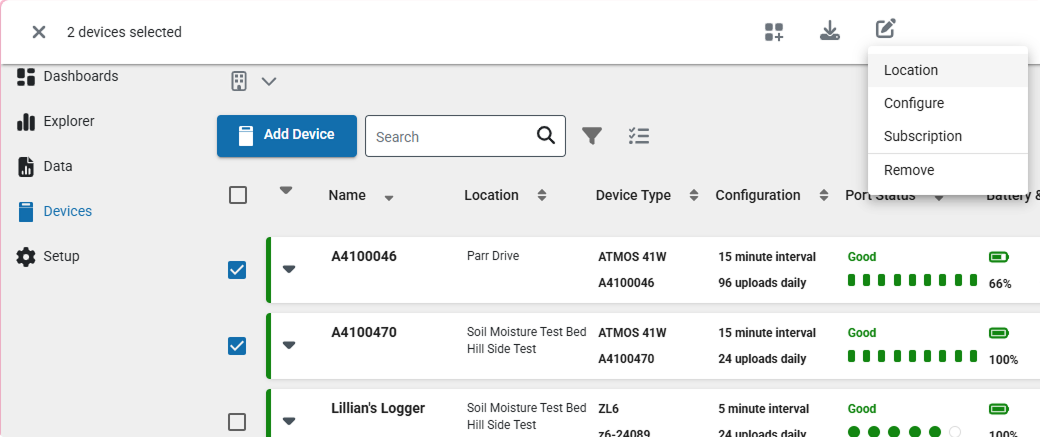
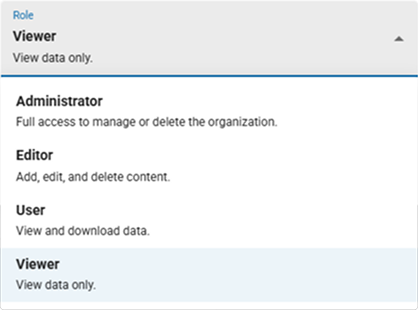
- New Role - Viewer: The Viewer role has been introduced, allowing users to view data without the ability to download it.
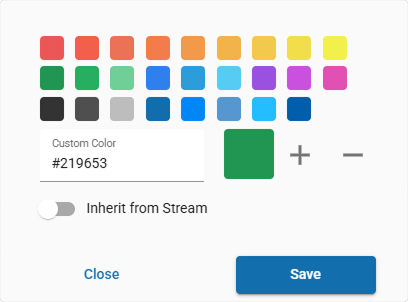
- Inherit Color: The trace color in custom charts can now be reset to match the source color, ensuring consistency in your visualizations.
- Device Info: The collapse or open state of device details is now saved to local storage, remembering its state when you revisit the page.
- Projects: This feature is now available to all users, offering early access to new project functionalities.
- Fixed
- Fixed page crash on Firefox.
- Fixed issues with chart period selection.
- Corrected minor layout issues and improved accessibility.
- Fixed some dropdown lists that jumped after selection.
Feb
- New models: We are excited to announce the addition of models to support unique applications. These models are designed to enhance your analysis by creating decision-making data. The new models include:
- Chill hours: Measure the cumulative hours of cold temperatures required for certain plants to break dormancy.
- Chill portions: Calculate the portions of chill required for optimal plant growth.
- Daily light integral: Assess the total amount of light received by plants each day.
- Daily light photoperiod: Track the duration of light exposure for plants on a daily basis.
- Evapotranspiration: Estimate the amount of water transferred from land to the atmosphere through evaporation and plant transpiration.
- Groundwater depth: Monitor the depth of groundwater levels.
- Groundwater elevation: Measure the elevation of groundwater above sea level.
- Growing degree days: Calculate the accumulated heat required for plant development.
- Growing degree hours: Measure the hourly accumulation of heat for plant growth.
- Leaf wetness amount of water: Track the amount of water present on plant leaves.
- Wind chill: Assess the cooling effect of wind on temperature.
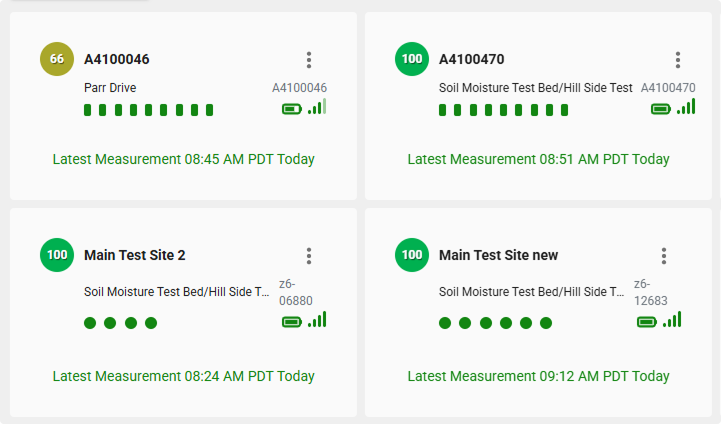
- Grid View for Devices: Enhance the way you consume the latest measurements. You can now choose between two viewing options:
- Grid View: Display devices in a grid format for a more visual and organized layout.
- List View: View devices in a list format for a detailed and linear arrangement.
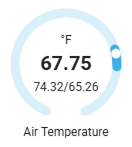
- Gauges for Device Readings: You can now choose between two viewing options for each sensor port:
- Gauge View: Display the latest device readings as gauges for a more visual and intuitive representation. The gauge view also includes max and min values where appropriate.
- Value View: View the latest device readings as simple numerical values for a more compact and straightforward analysis.
- Fixed
- The chart period is now saved to the dashboard.
- Removed RAW as a unit option.
- Fixed issues with navigation.
Jan
- Start a New Chart from Chart Editor: You can now directly start creating a new chart from the editor without needing to return to the Explorer main page, streamlining your workflow.
- Improved Device Search in Projects: Enhanced search functionality for devices within projects, making it easier to find and manage your devices.
- Targets: You can now create and add targets for Range, Threshold, SUM, and Delta to your charts, providing more precise and customizable data analysis.
- New Unit Options: Added new units for mS/m and dS/m, expanding the range of measurement choices available for your data.
- No Data Message: Added a message for charts that contain no data, ensuring clear communication when data is unavailable.
- Fixed
- Fixed issue where the phone number was not optional when editing your profile.
- Fixed issues with the dashboard layout.
- Fixed issue where the Add To would close on Safari mobile.
- Fixed app crash when leaving the profile page.
2024
Dec
- Dashboard: You can now create custom dashboards, add charts to them, resize charts, and drag to reorder them on the dashboard. This provides a more personalized and flexible way to organize and view your data.
- Explorer: The explorer editor allows you to create custom charts with full control over naming, colors, axes, legends, and more. Tailor your charts to meet your specific needs and preferences.
- Fixed
- Improved the date range picker for custom date ranges.
- Fixed the period selection for default chart periods so it persists.
- Fixed a display issue for the axis bounds label.
- Fixed the fullscreen map from covering the toolbar.
- Fixed the device view page not loading.
- Fixed issue that caused crash when viewing source.
How did we do?
ZENTRA Cloud 1.0 Release Logs