Table of Contents
Dashboards
How to create a dashboard.
Table of Contents
Create a customized dashboard to display graphs, tables, maps, and other key data in one place, giving you a quick and easy way to monitor and analyze performance, trends, and metrics.
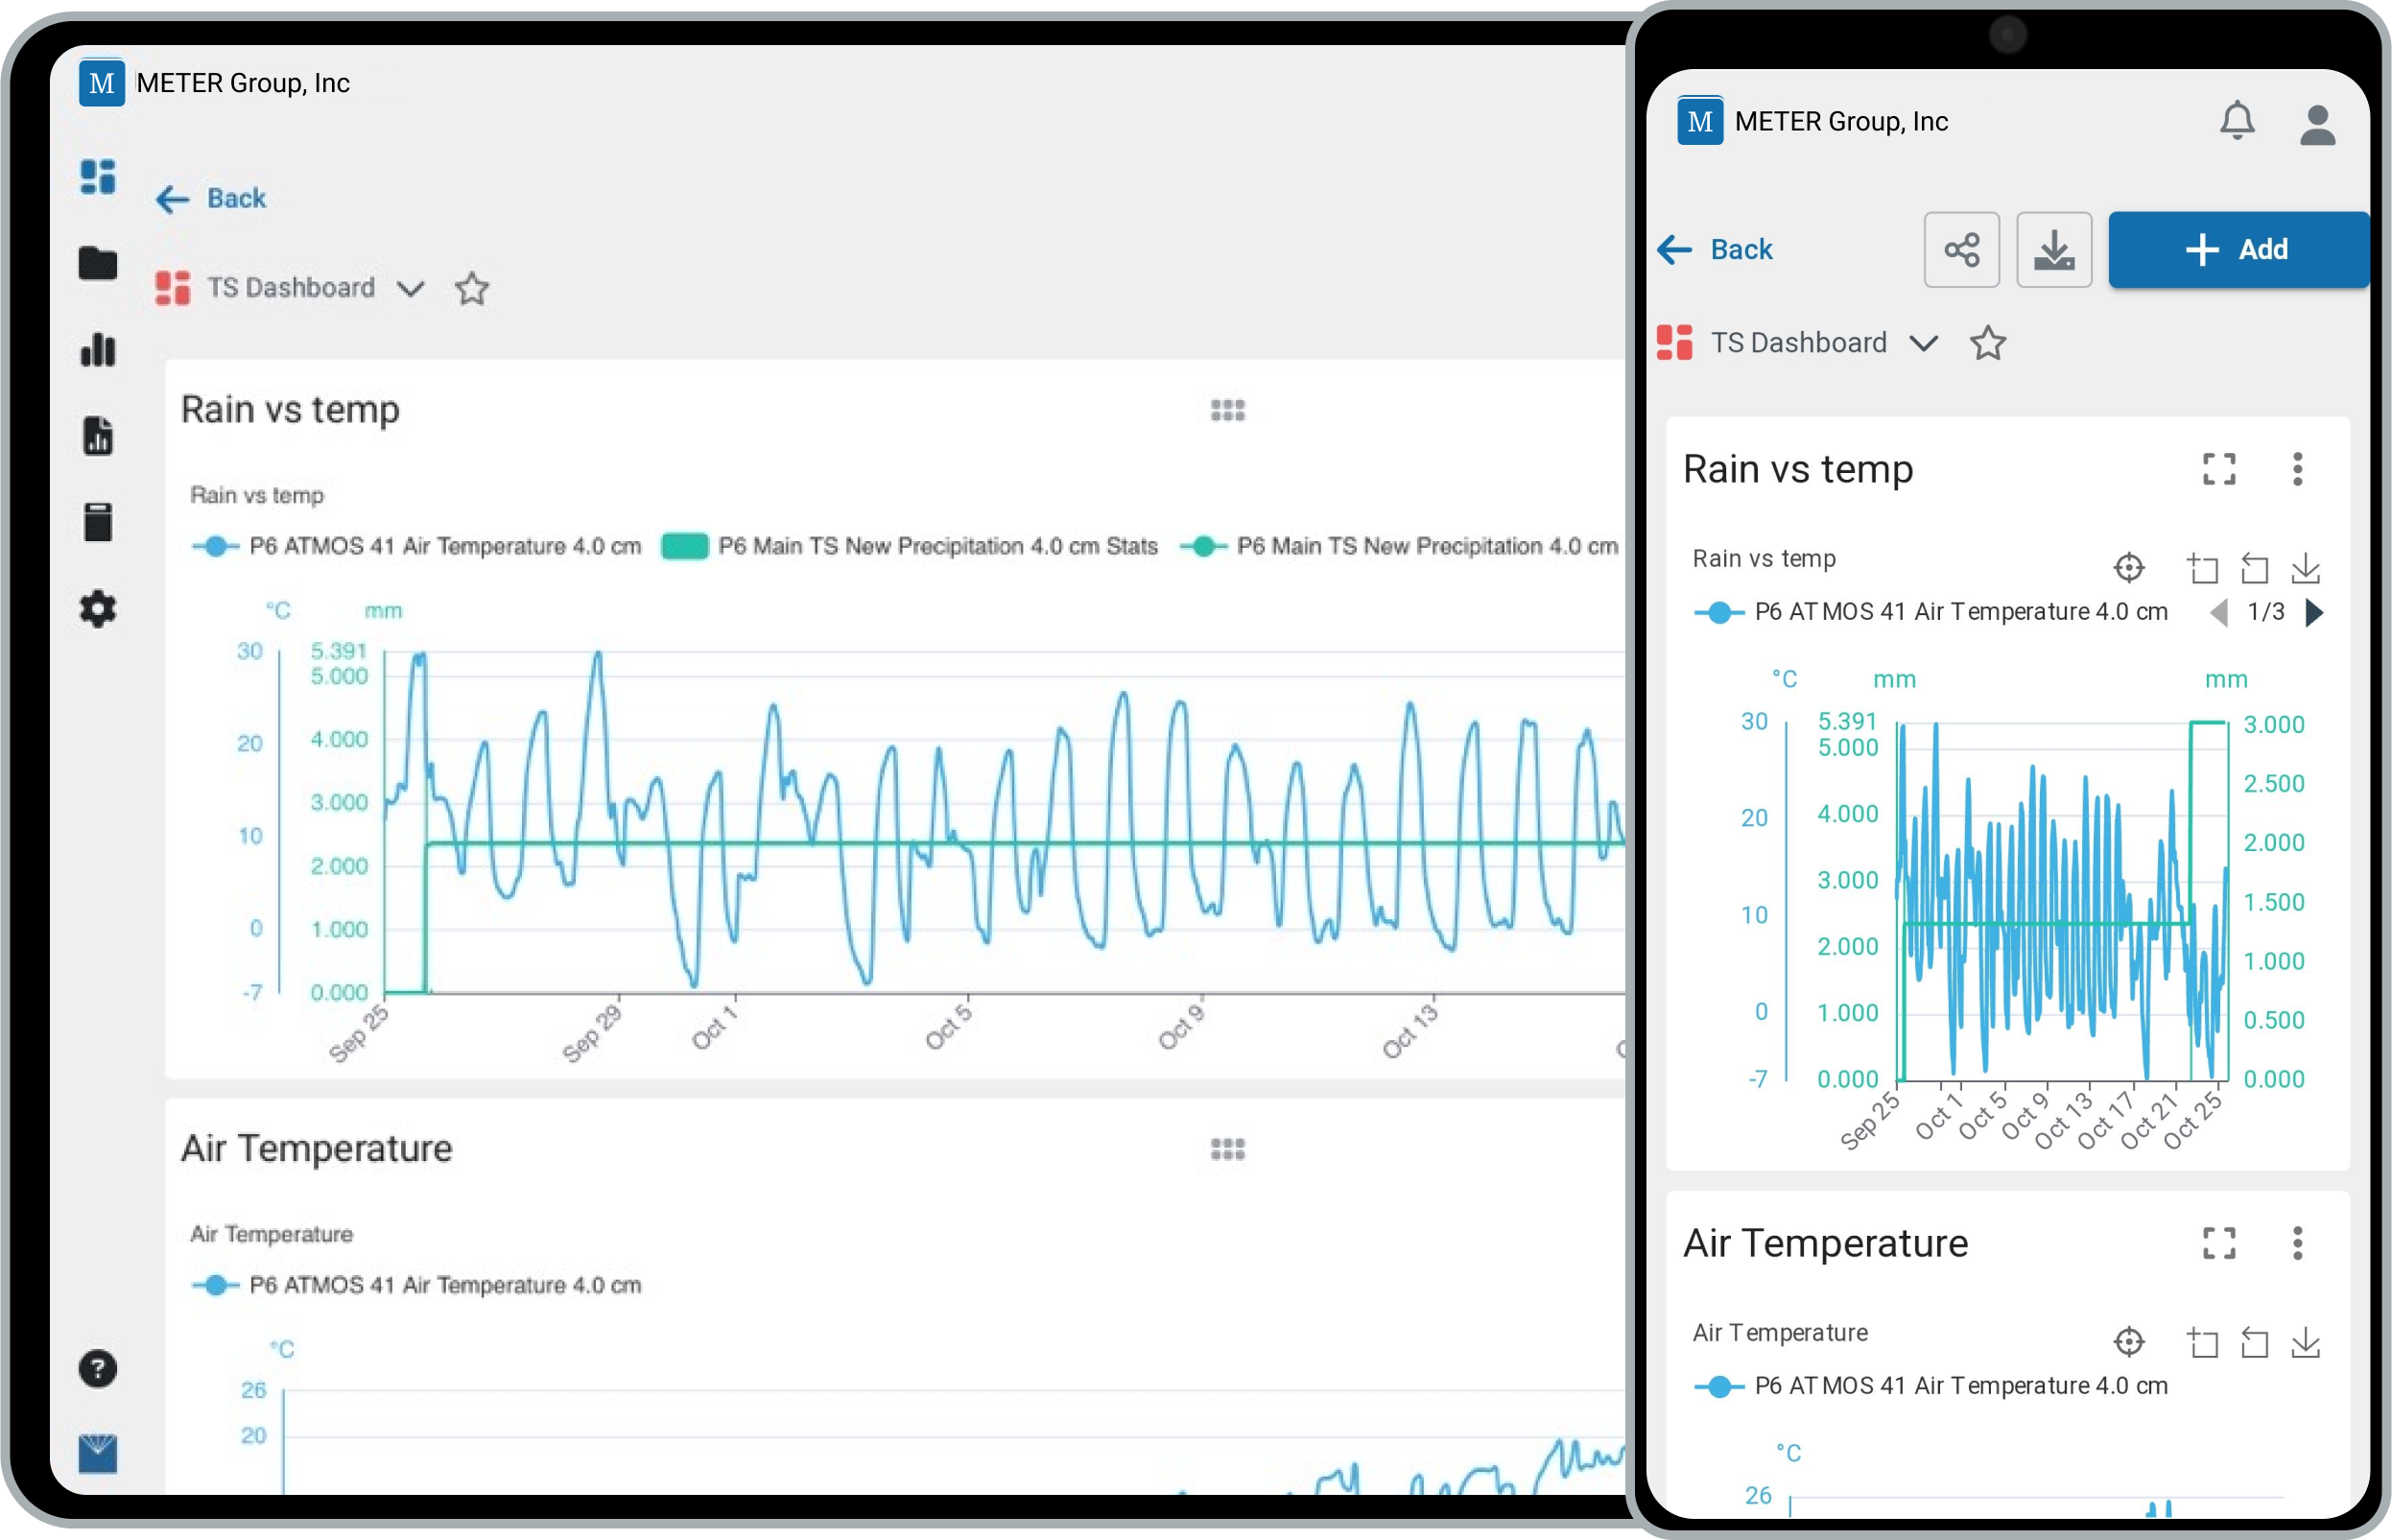
Create a dashboard
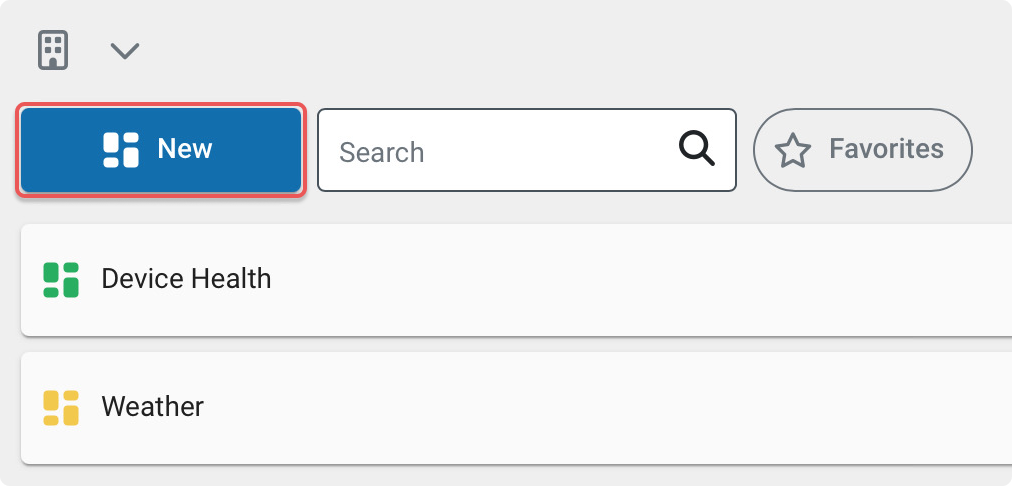
- In the navigation menu, click Dashboards.
- Click New.
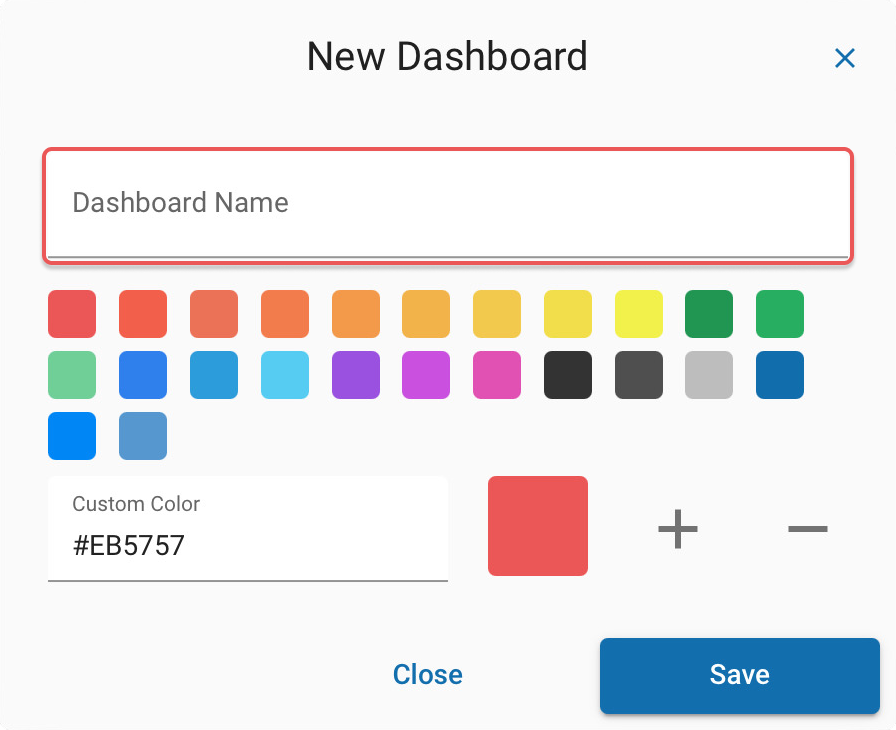
- Enter a name for the dashboard and click Save.
Add content
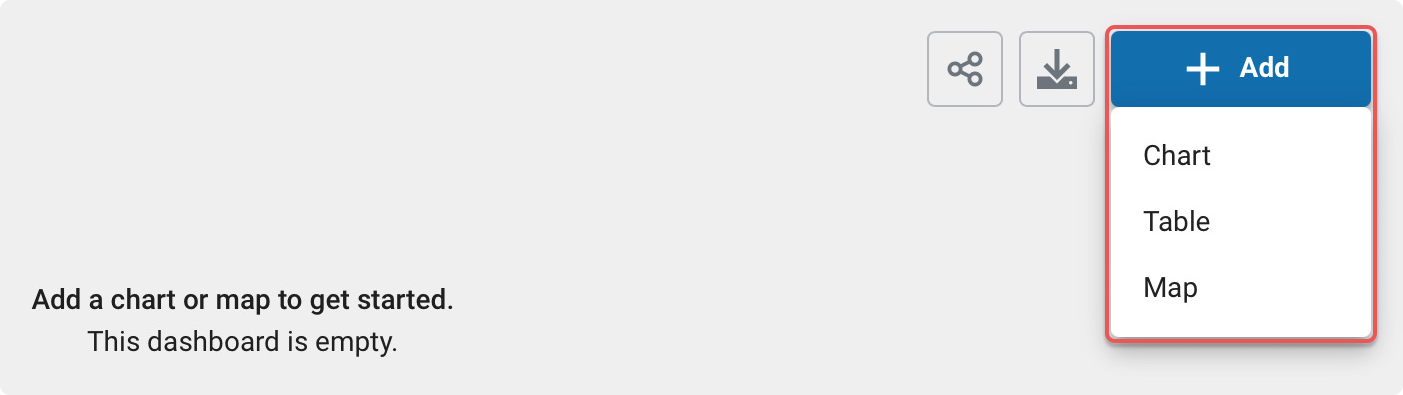
- Open the dashboard by selecting it.
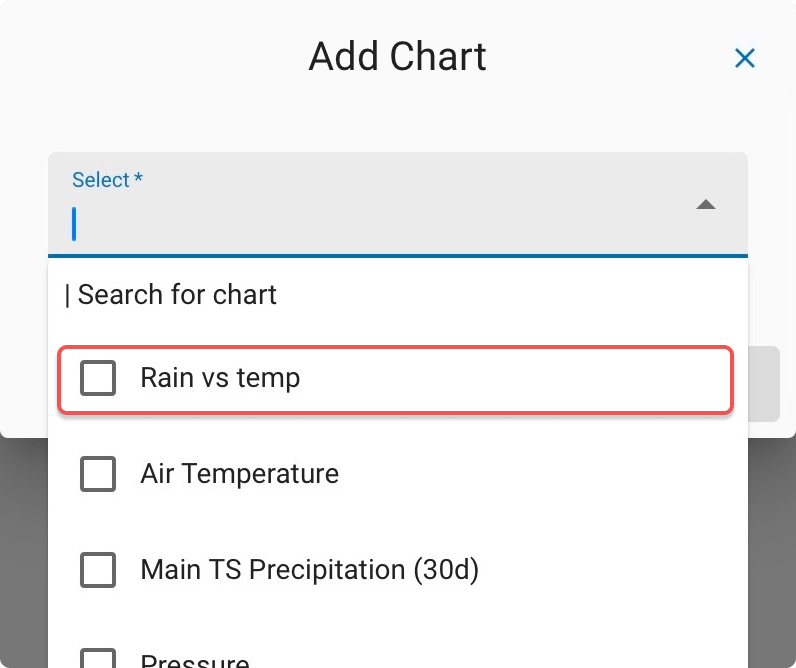
- Click + Add, then Chart.
- Select the checkboxes for the charts you want, then click Add. To build a new chart instead, click Create New.
Customize the layout
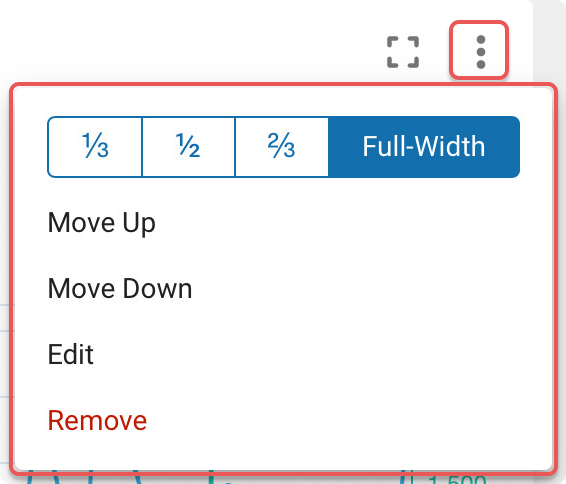
- To resize a chart, click the Ellipsis to open the chart options menu.
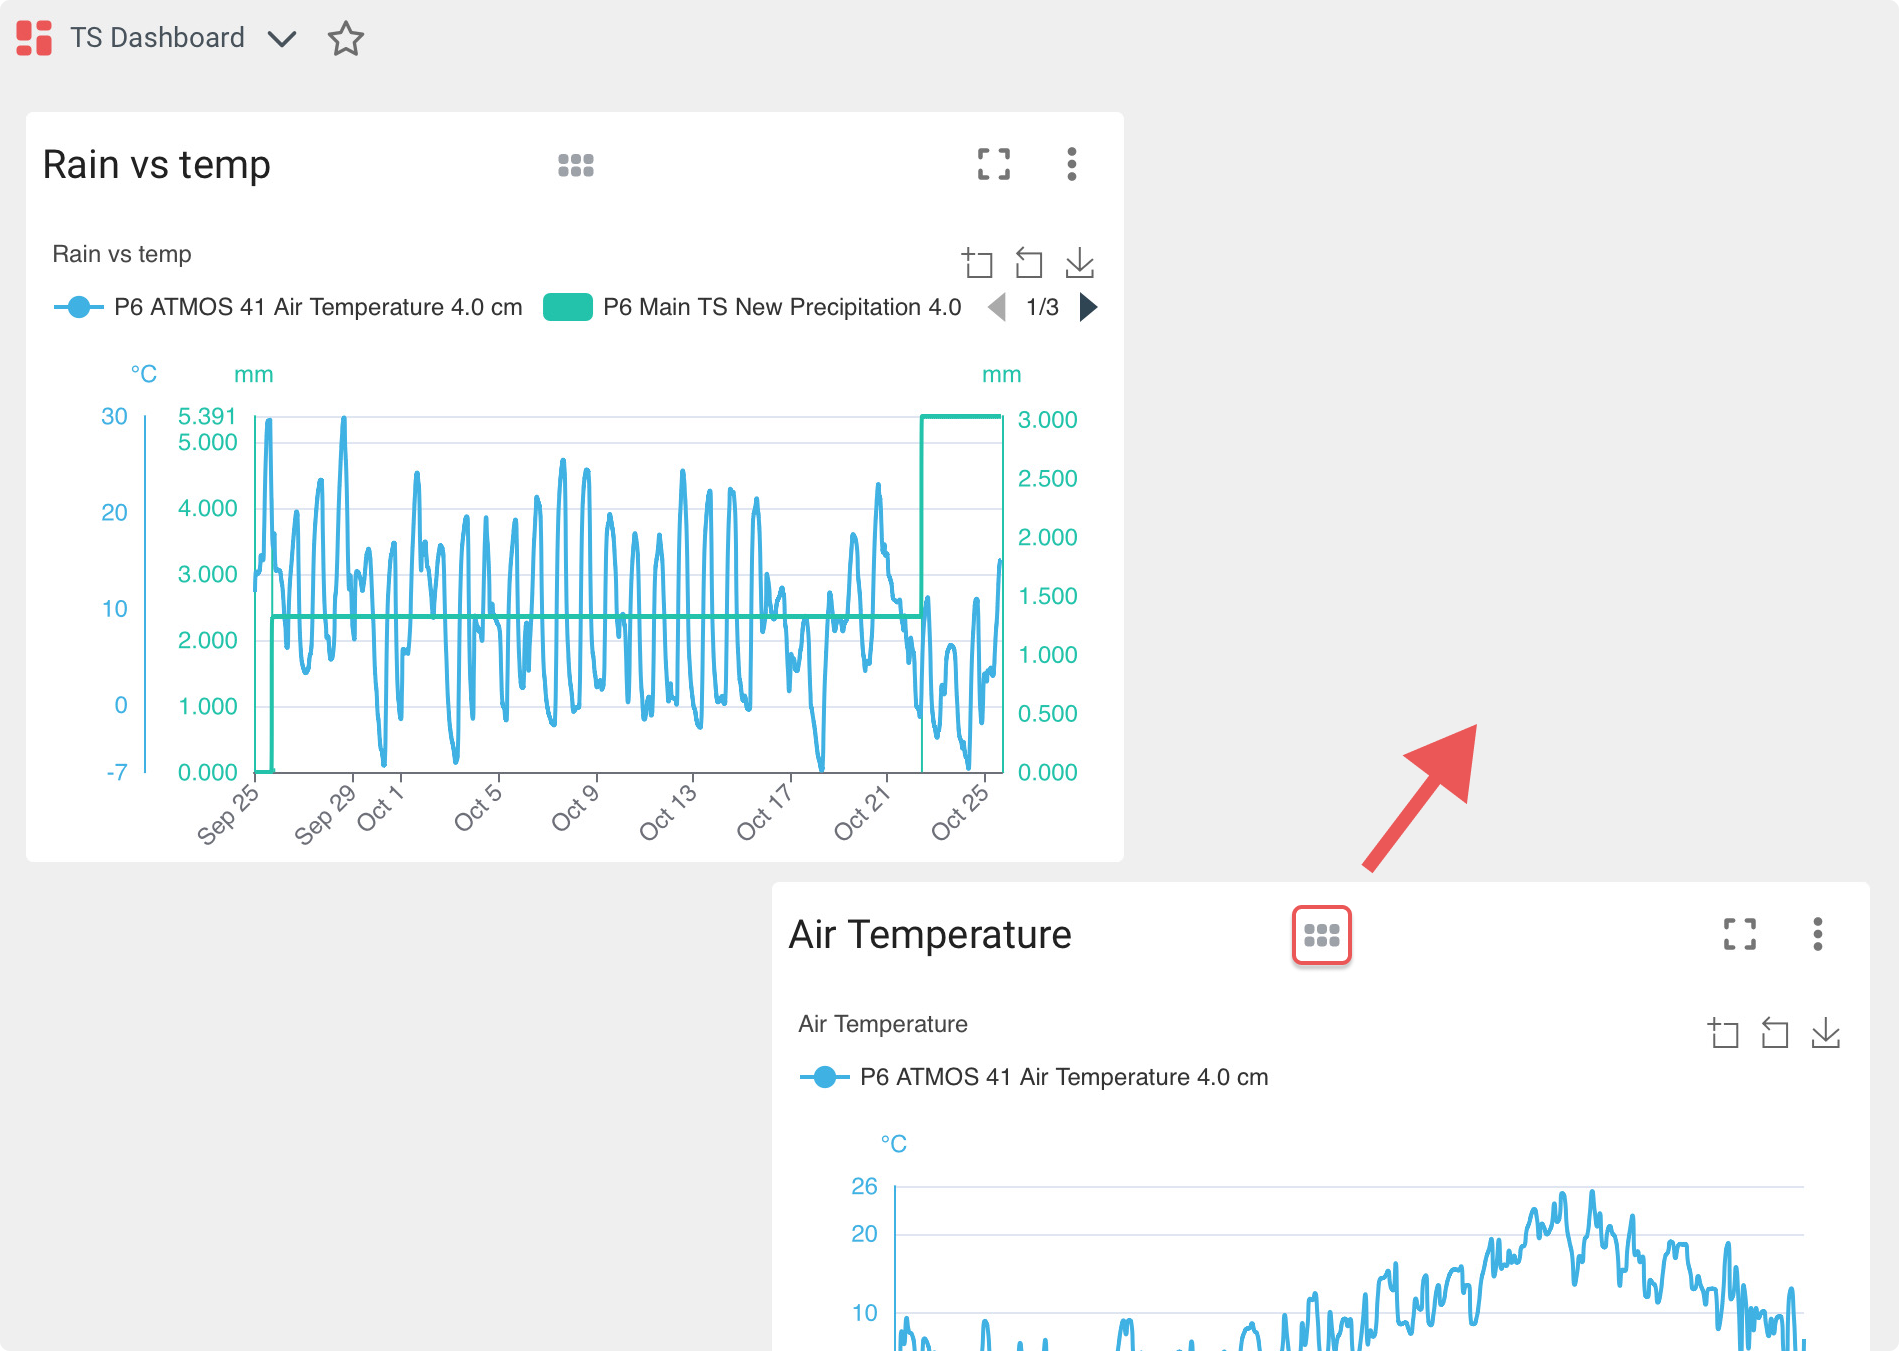
- To reorder charts, drag them up or down using the Grip icon.
Focus on one chart
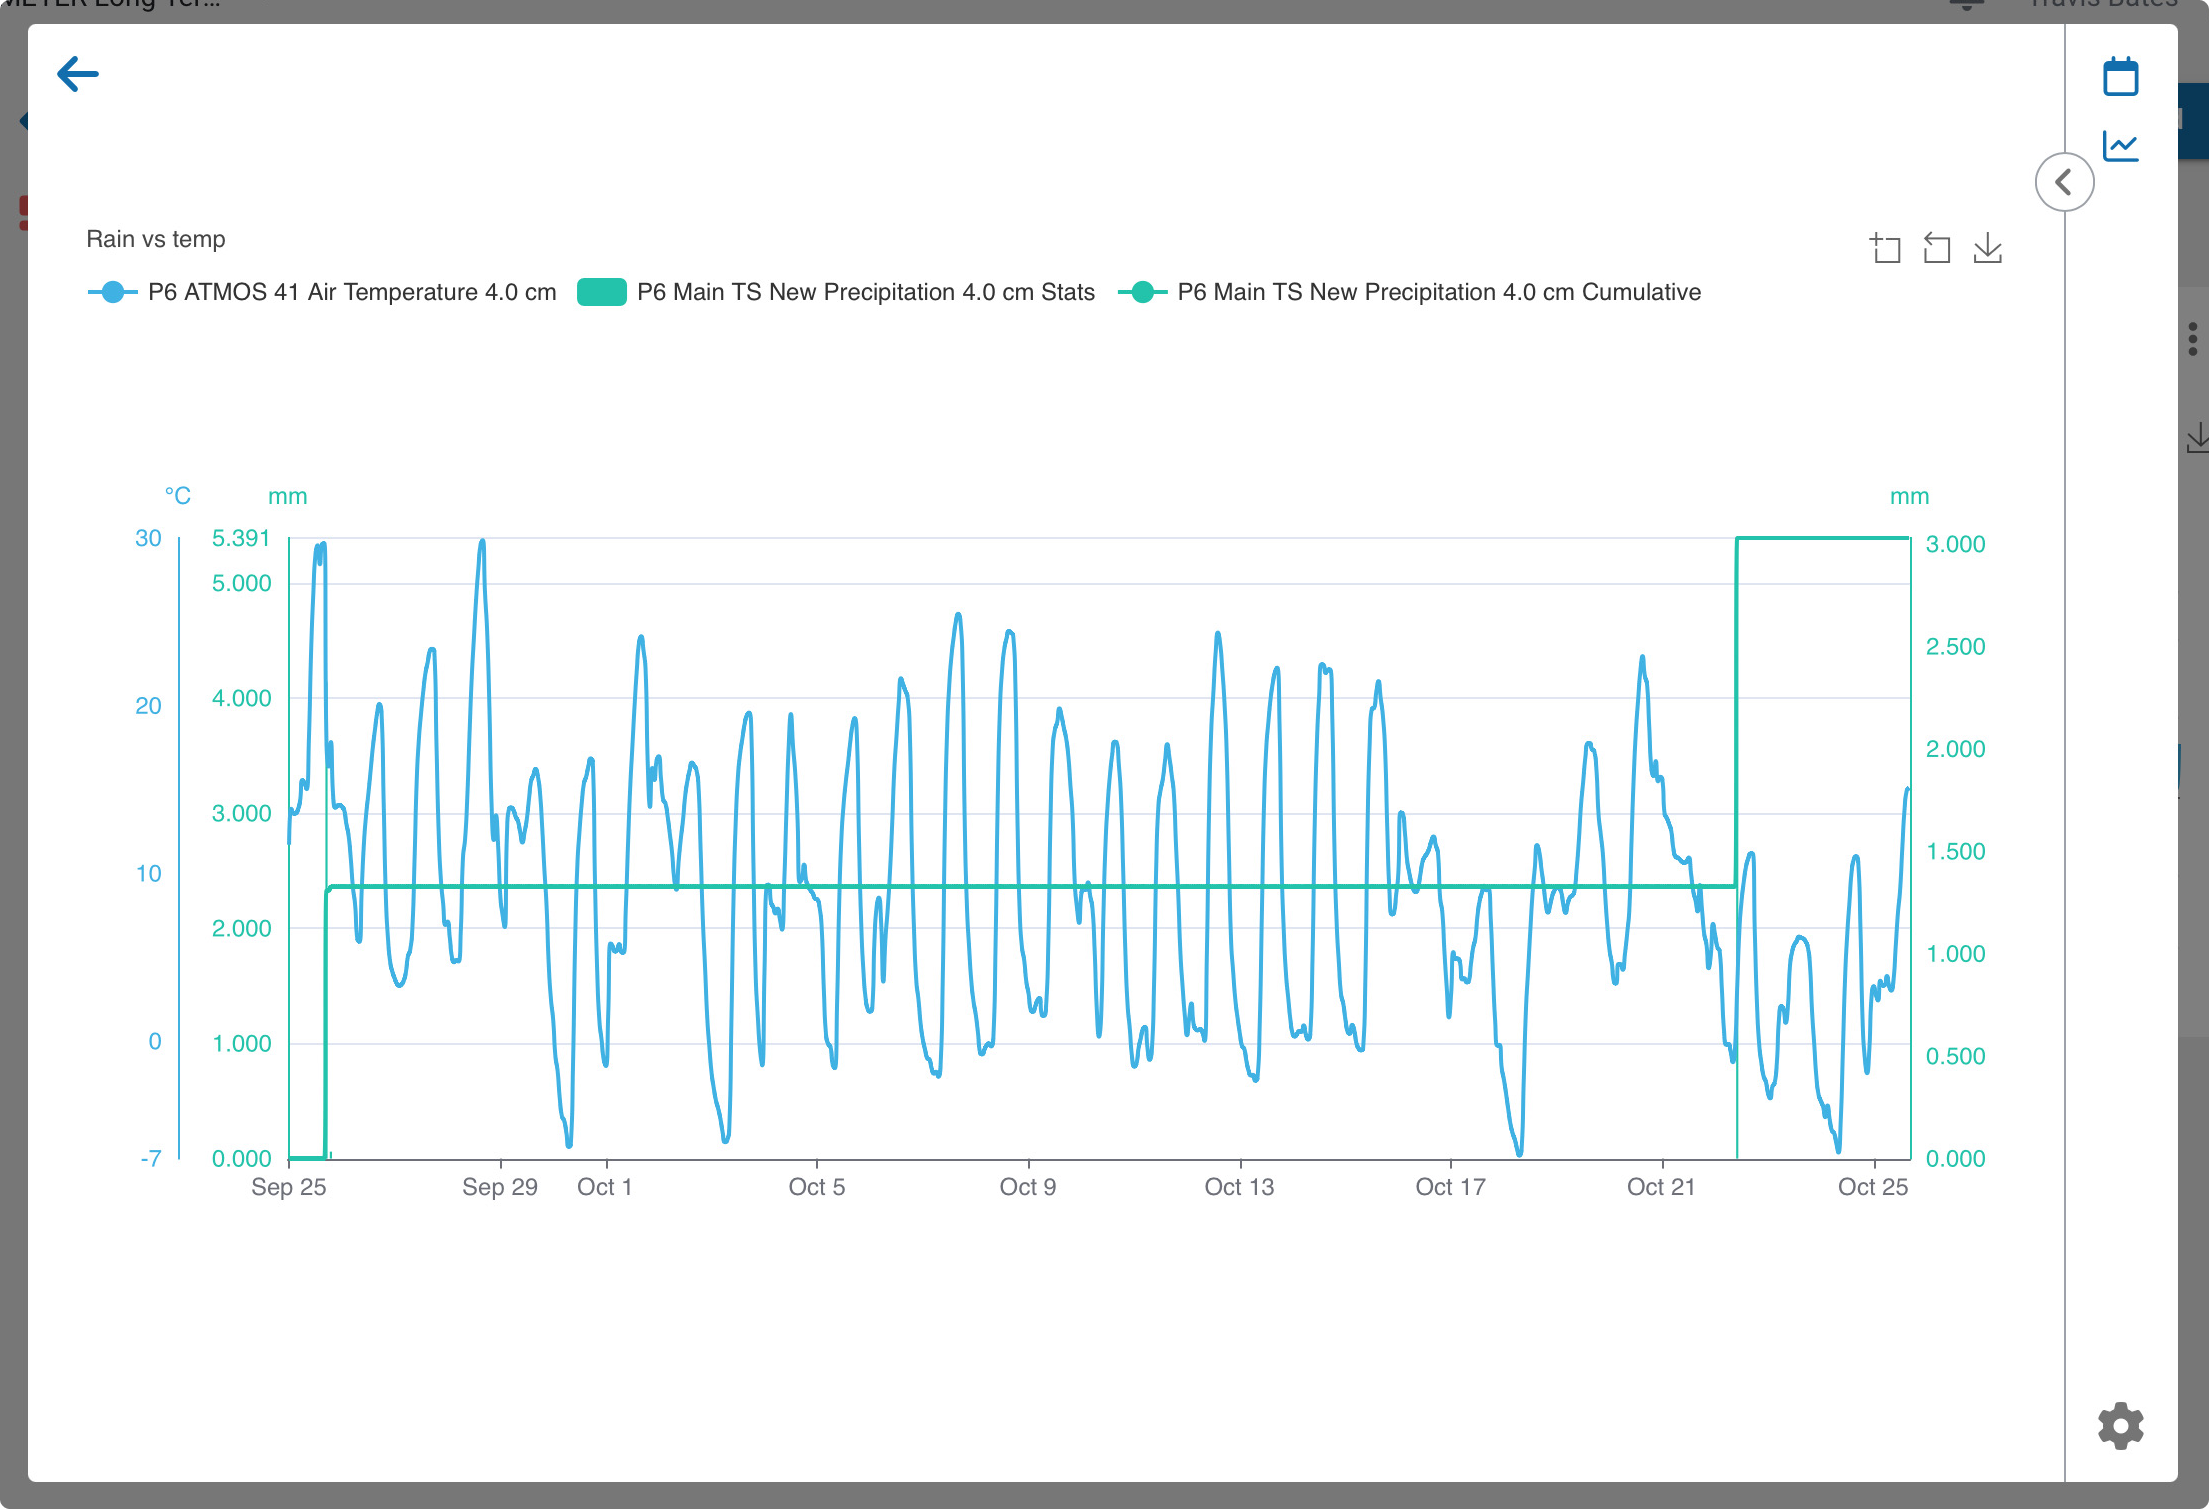
Click the Expand icon to focus on a single chart at a time. This is also the optimized view for mobile.
How-To-Video
How did we do?
Explorer: Targets