Table of Contents
Explorer: Build a Custom Graph
How to create and edit custom graphs.
Table of Contents
The Explorer helps you analyze your data with custom visualizations, including graphs, tables, and maps. Build visuals to fit your application, then group and share them using dashboards.
≤ 14 days → Unaggregated
≤ 90 days → Aggregated hourly
> 90 days → Aggregated daily
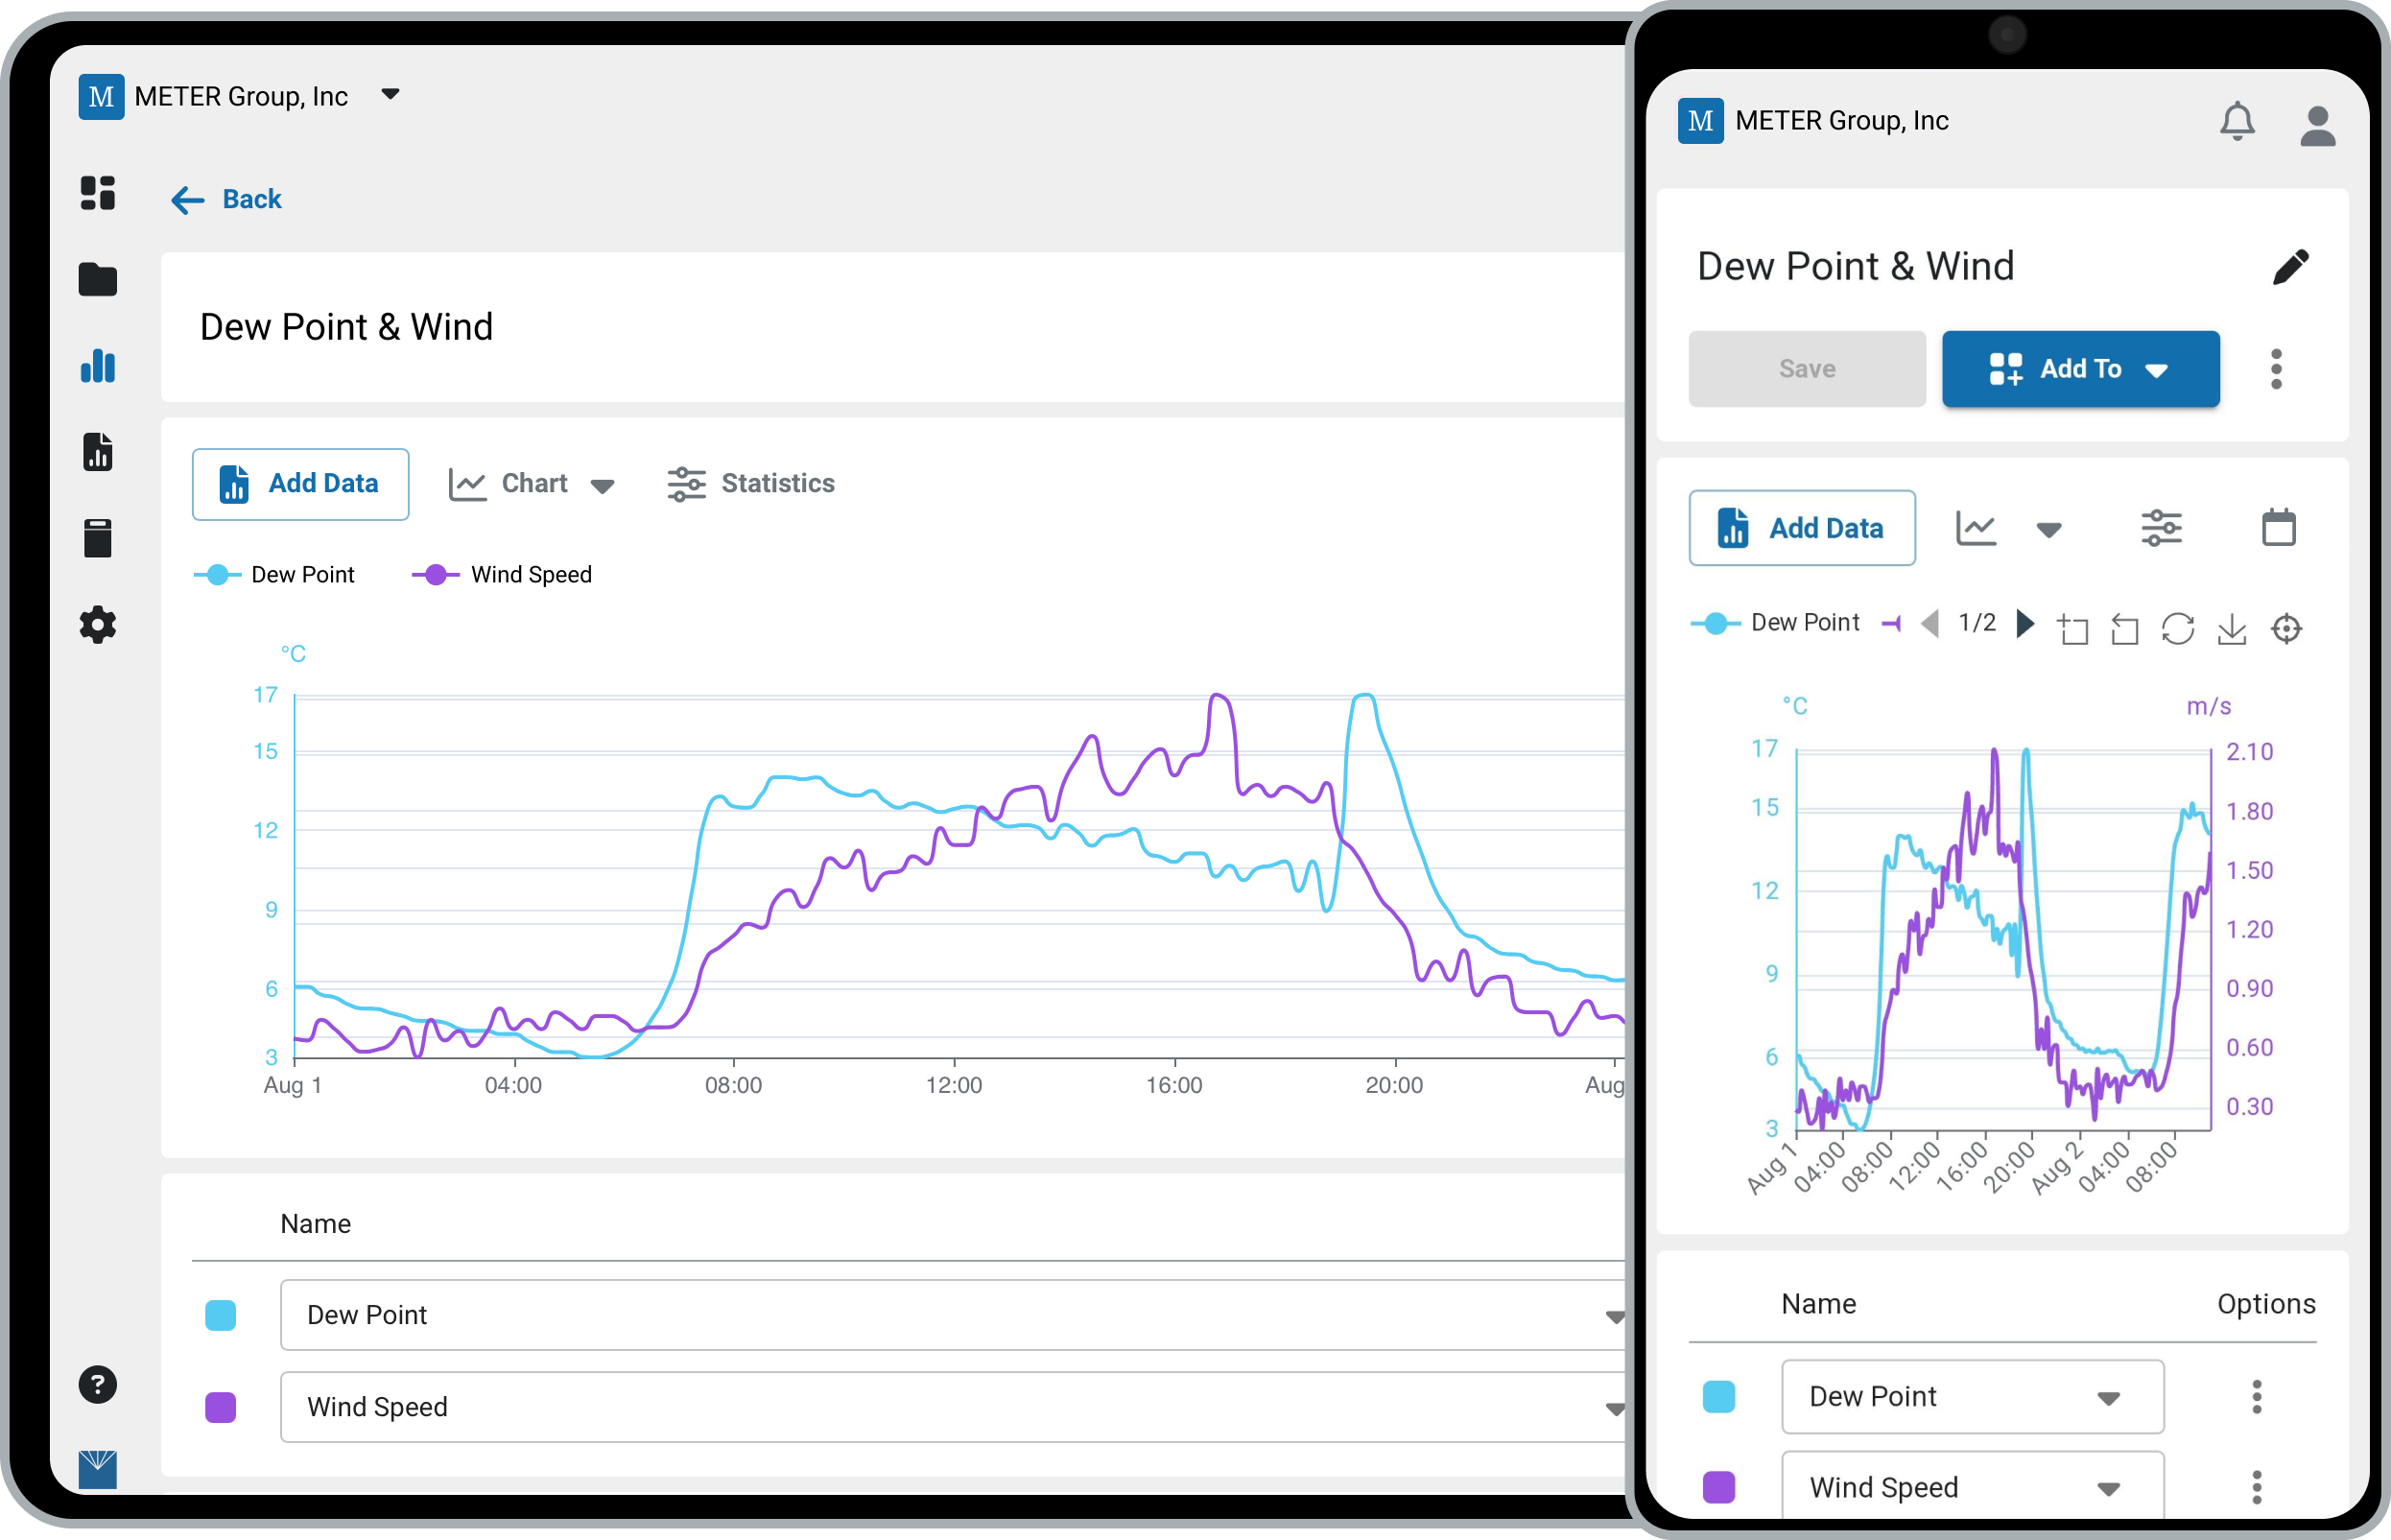
Create a graph
- In the navigation menu, click Explorer.
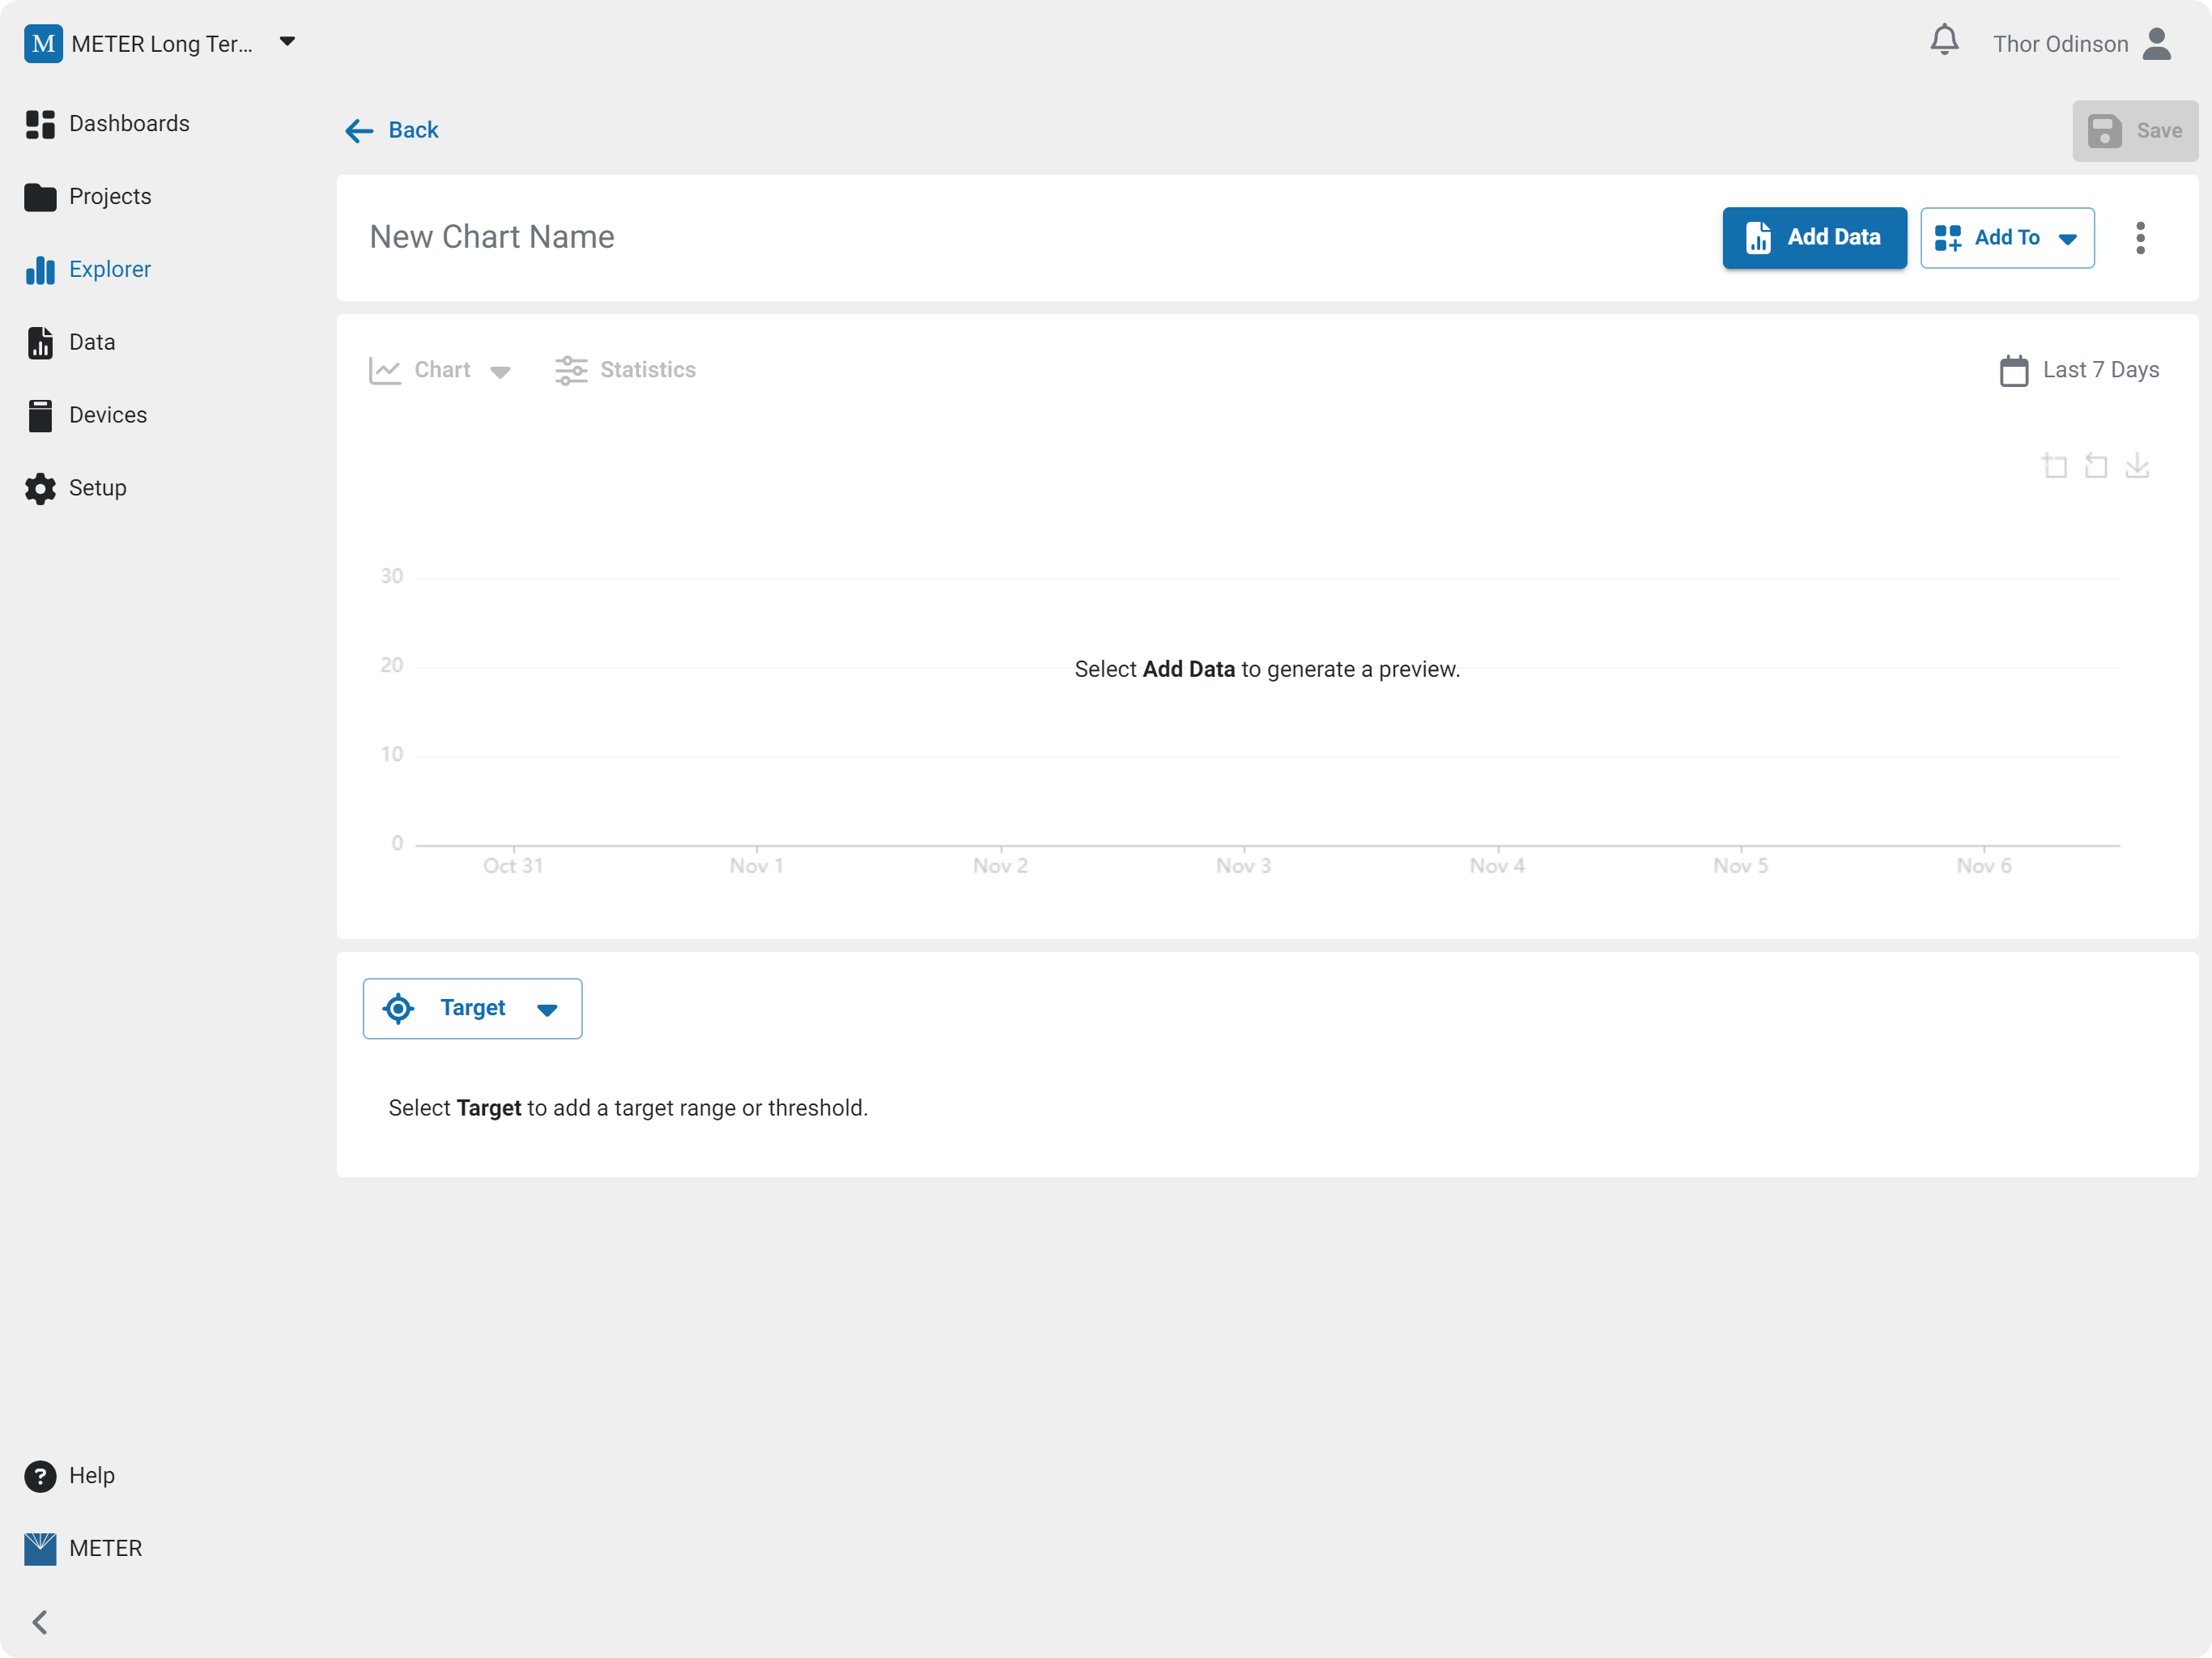
- Click Create to build a new graph, table, or map.
- Click Add Data to open the data panel.
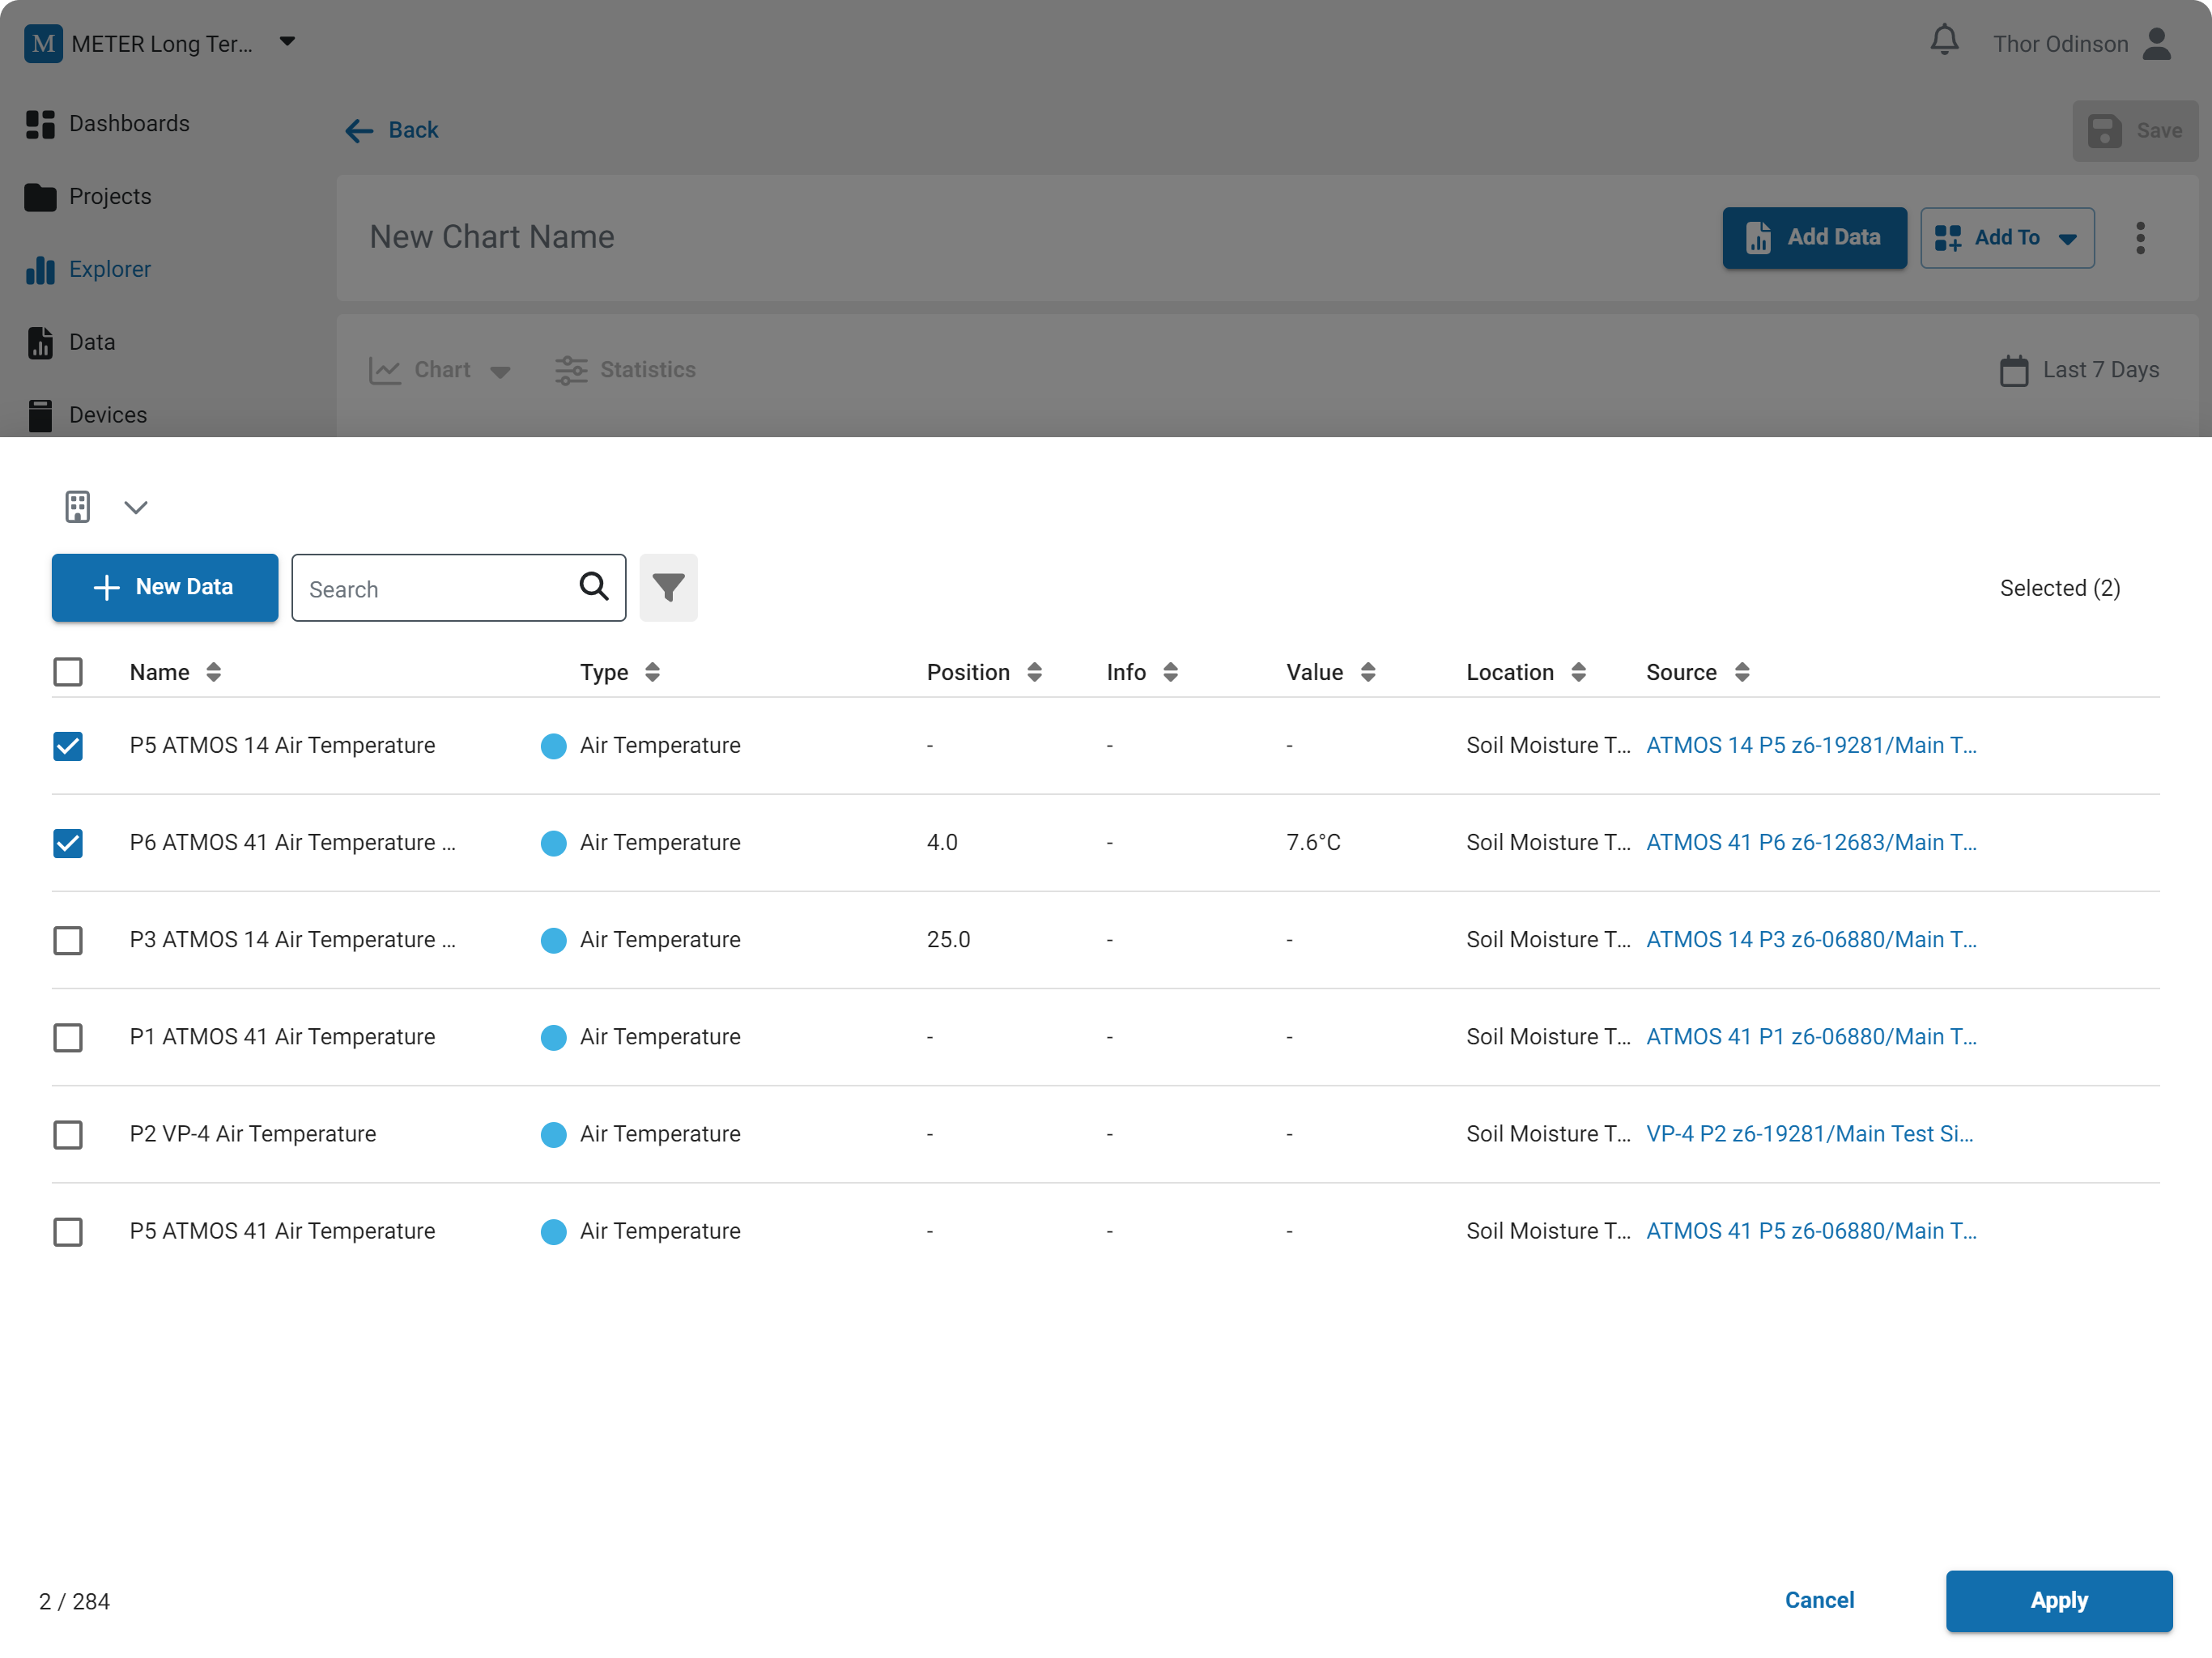
Add data
Search or filter the list of data, use the checkboxes to choose the data you want, then click Apply. The selected data appears below the graph, where you can edit its color, name, position (height/depth), axis, and order in the legend.
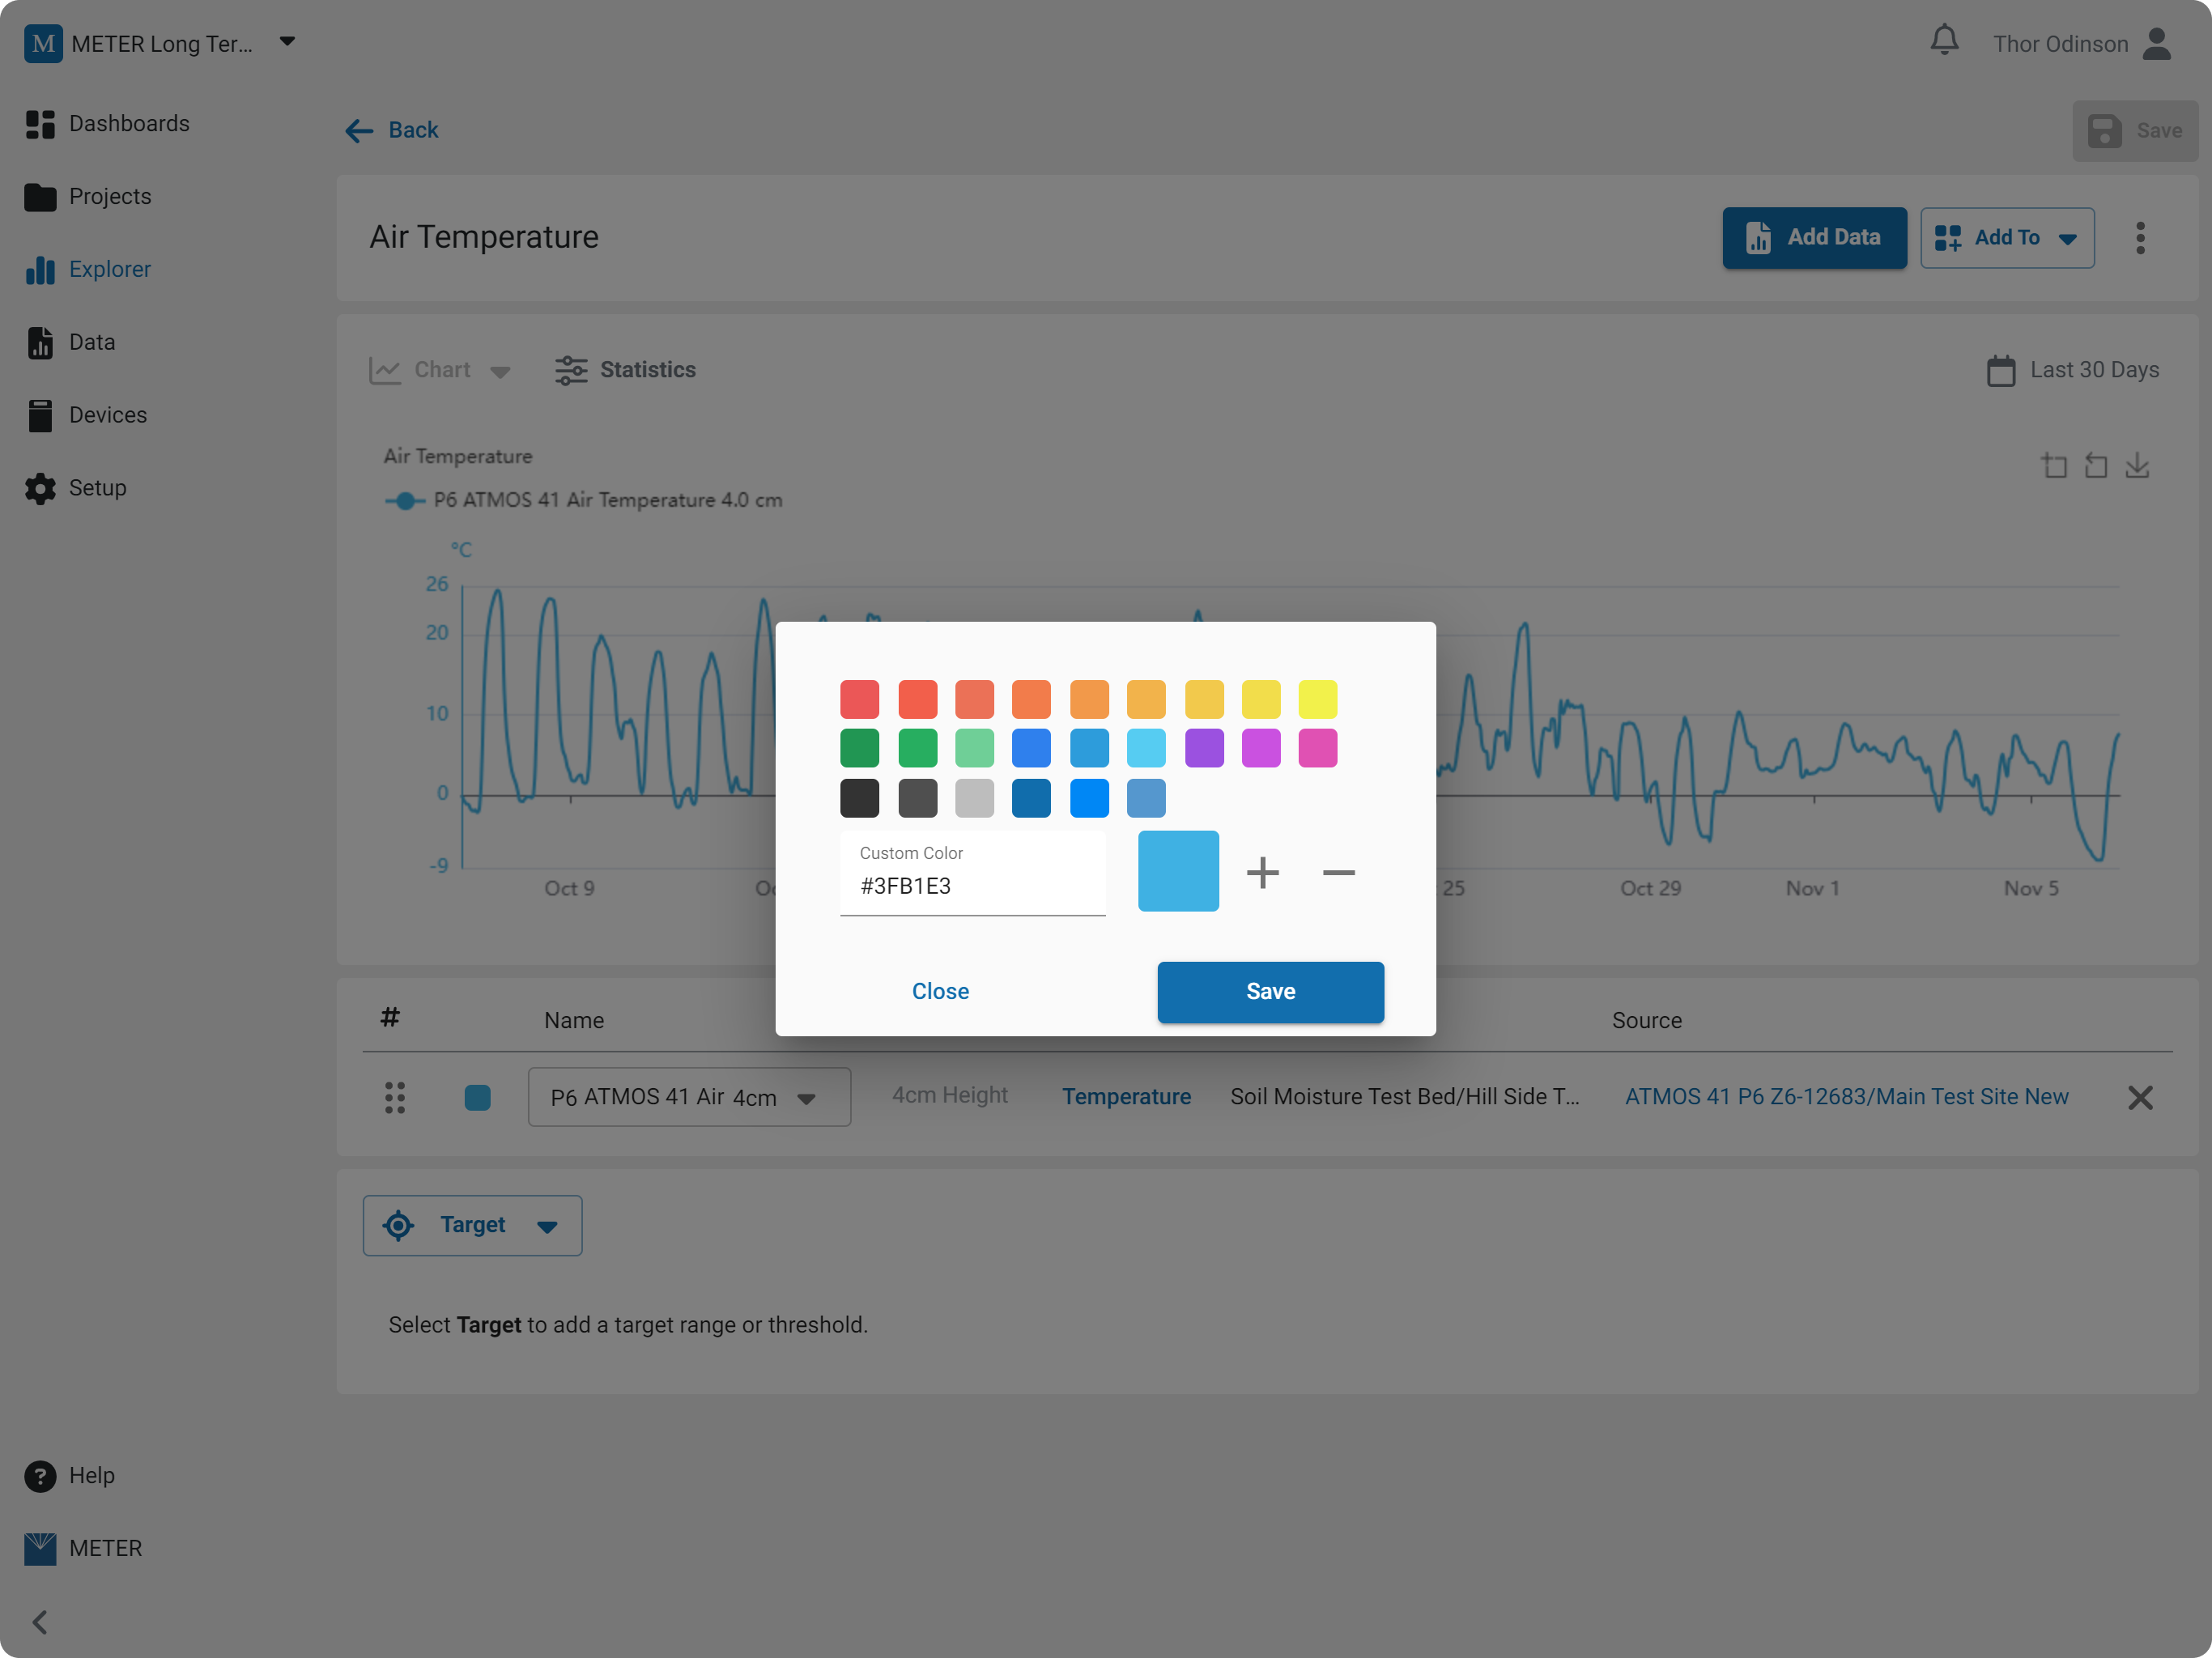
Trace color
Select the color swatch to customize the trace color.
Trace name
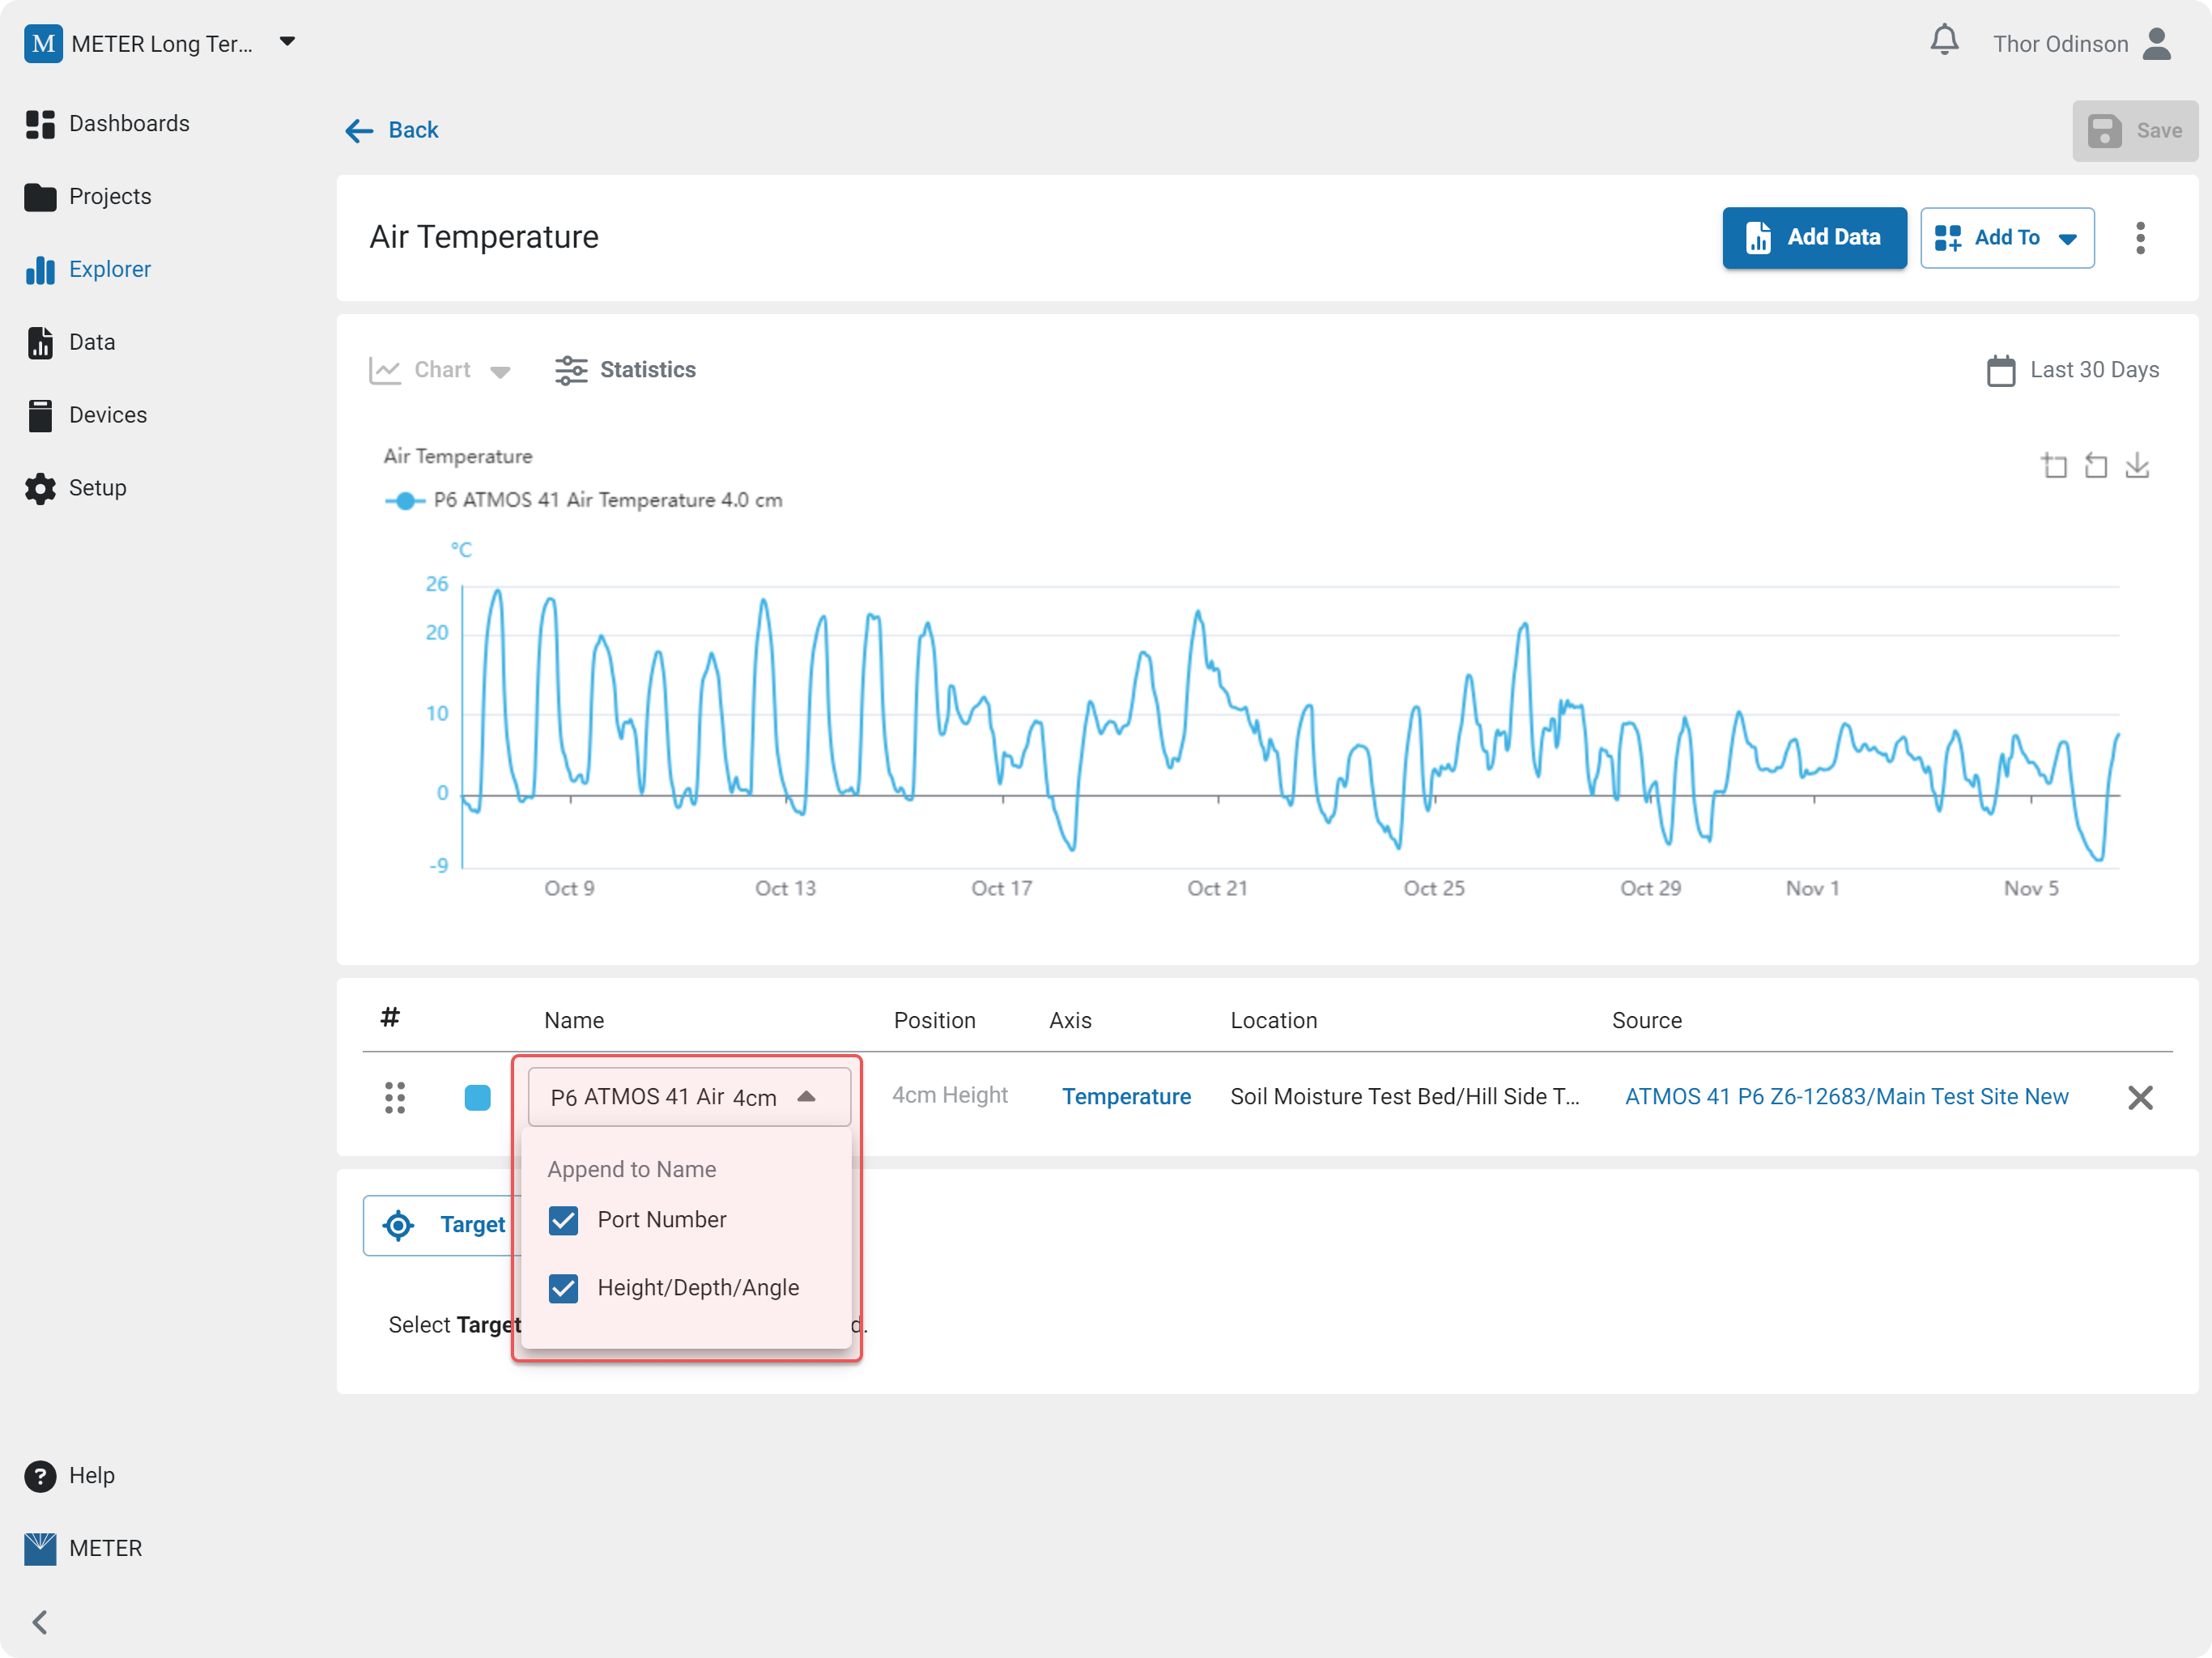
Edit the trace name. You can also choose whether to append the port number and position (height/depth/angle) to the name.
Axis options
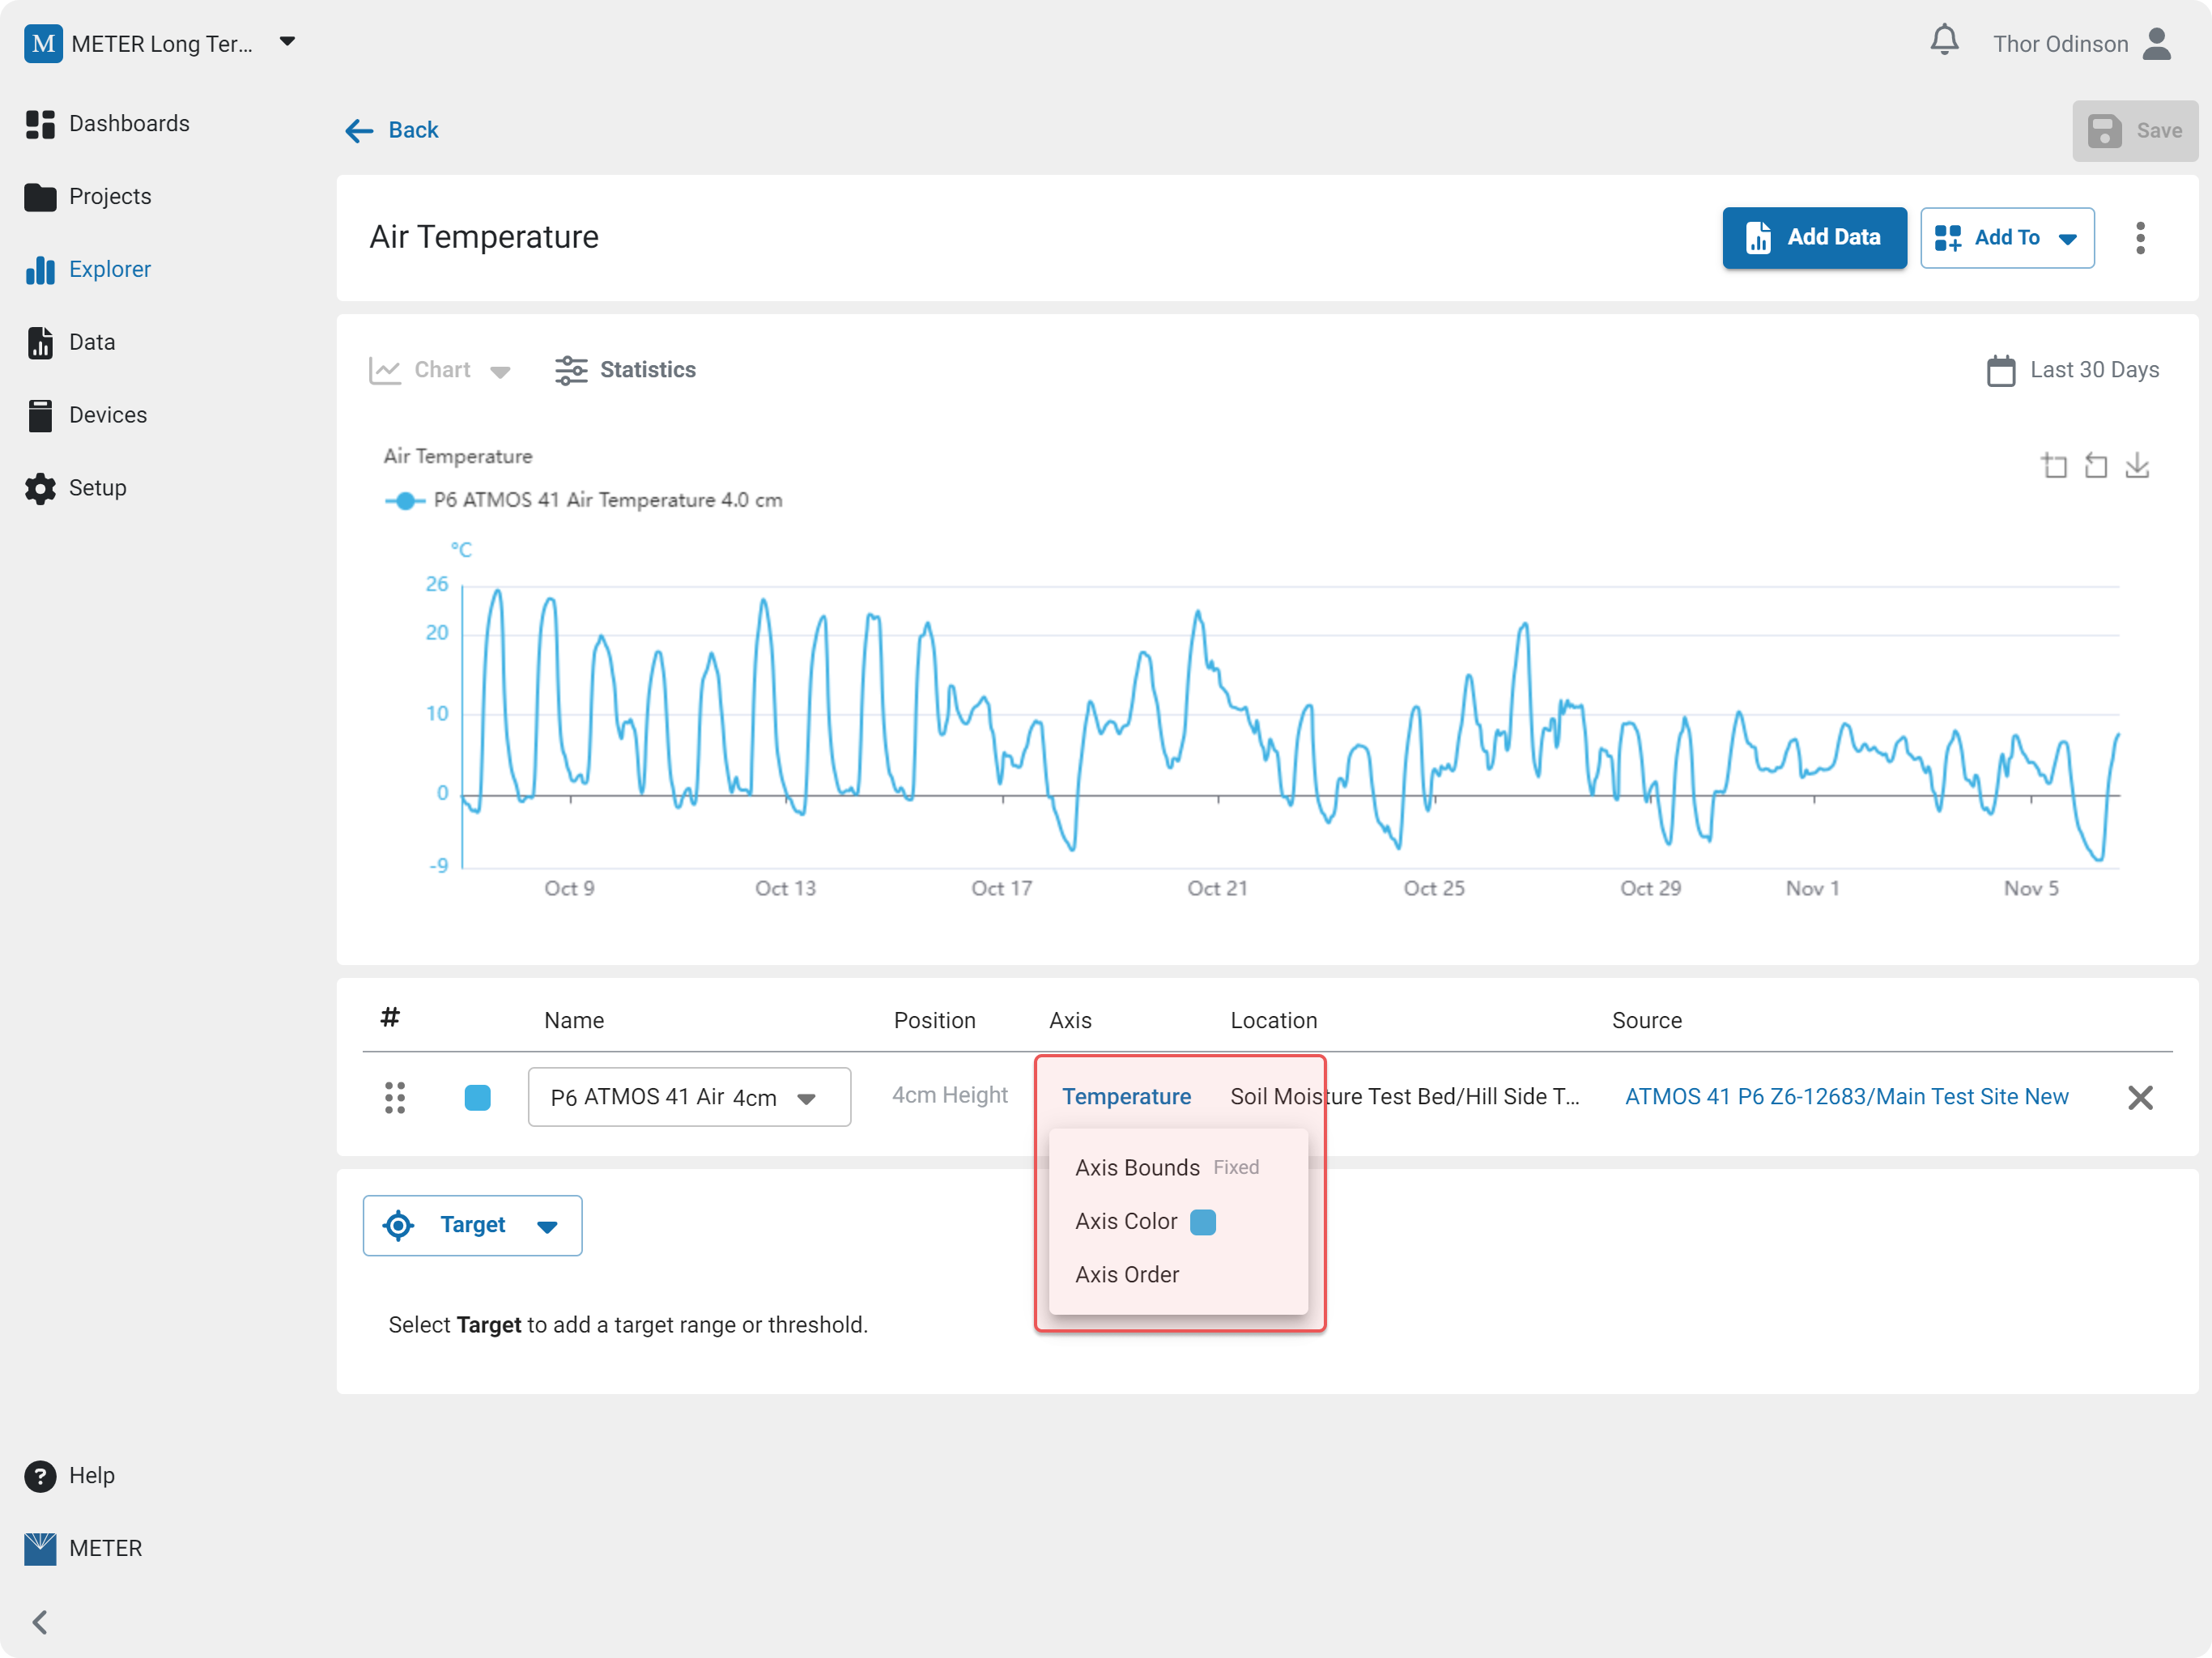
Configure the axis bounds, order, and color from the axis sub-menu:
- Axis bounds — set the upper and lower bounds.
- Axis order — arrange the order of the axes.
Save your graph
Before you can save, a graph needs a name and at least one datastream.
- Enter a name for the graph
- Add at least one datastream
- Click Save
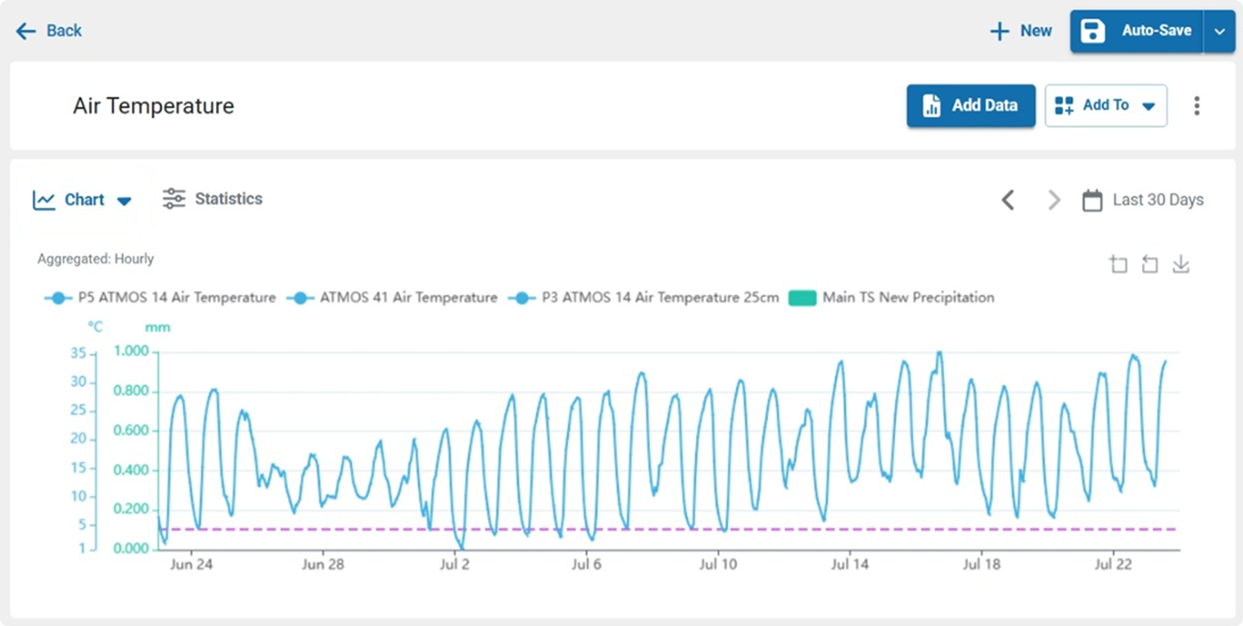
After the first save, you can keep editing and save your changes at any time, either manually with Save or automatically with Auto-save.
Auto-save
Auto-save keeps your graph up to date without clicking Save after every change — similar to a document editor. It is off by default, and your choice is remembered in your browser.
Turn auto-save on or off
1. Save the graph at least once. Auto-save does not run on a brand-new graph
2. Next to the Save button, click the dropdown arrow to open the save options
3. Choose Auto-save or Manual save. A check mark shows which is active
When on, the button reads Auto-save, and edits save a couple seconds after you stop typing (and when you switch tabs).
Save status: Saving… → Saved.
When changes can't be saved: Auto-save failed. (with Retry), a repeated-error auto-disable banner, and an offline warning.
Add to a dashboard
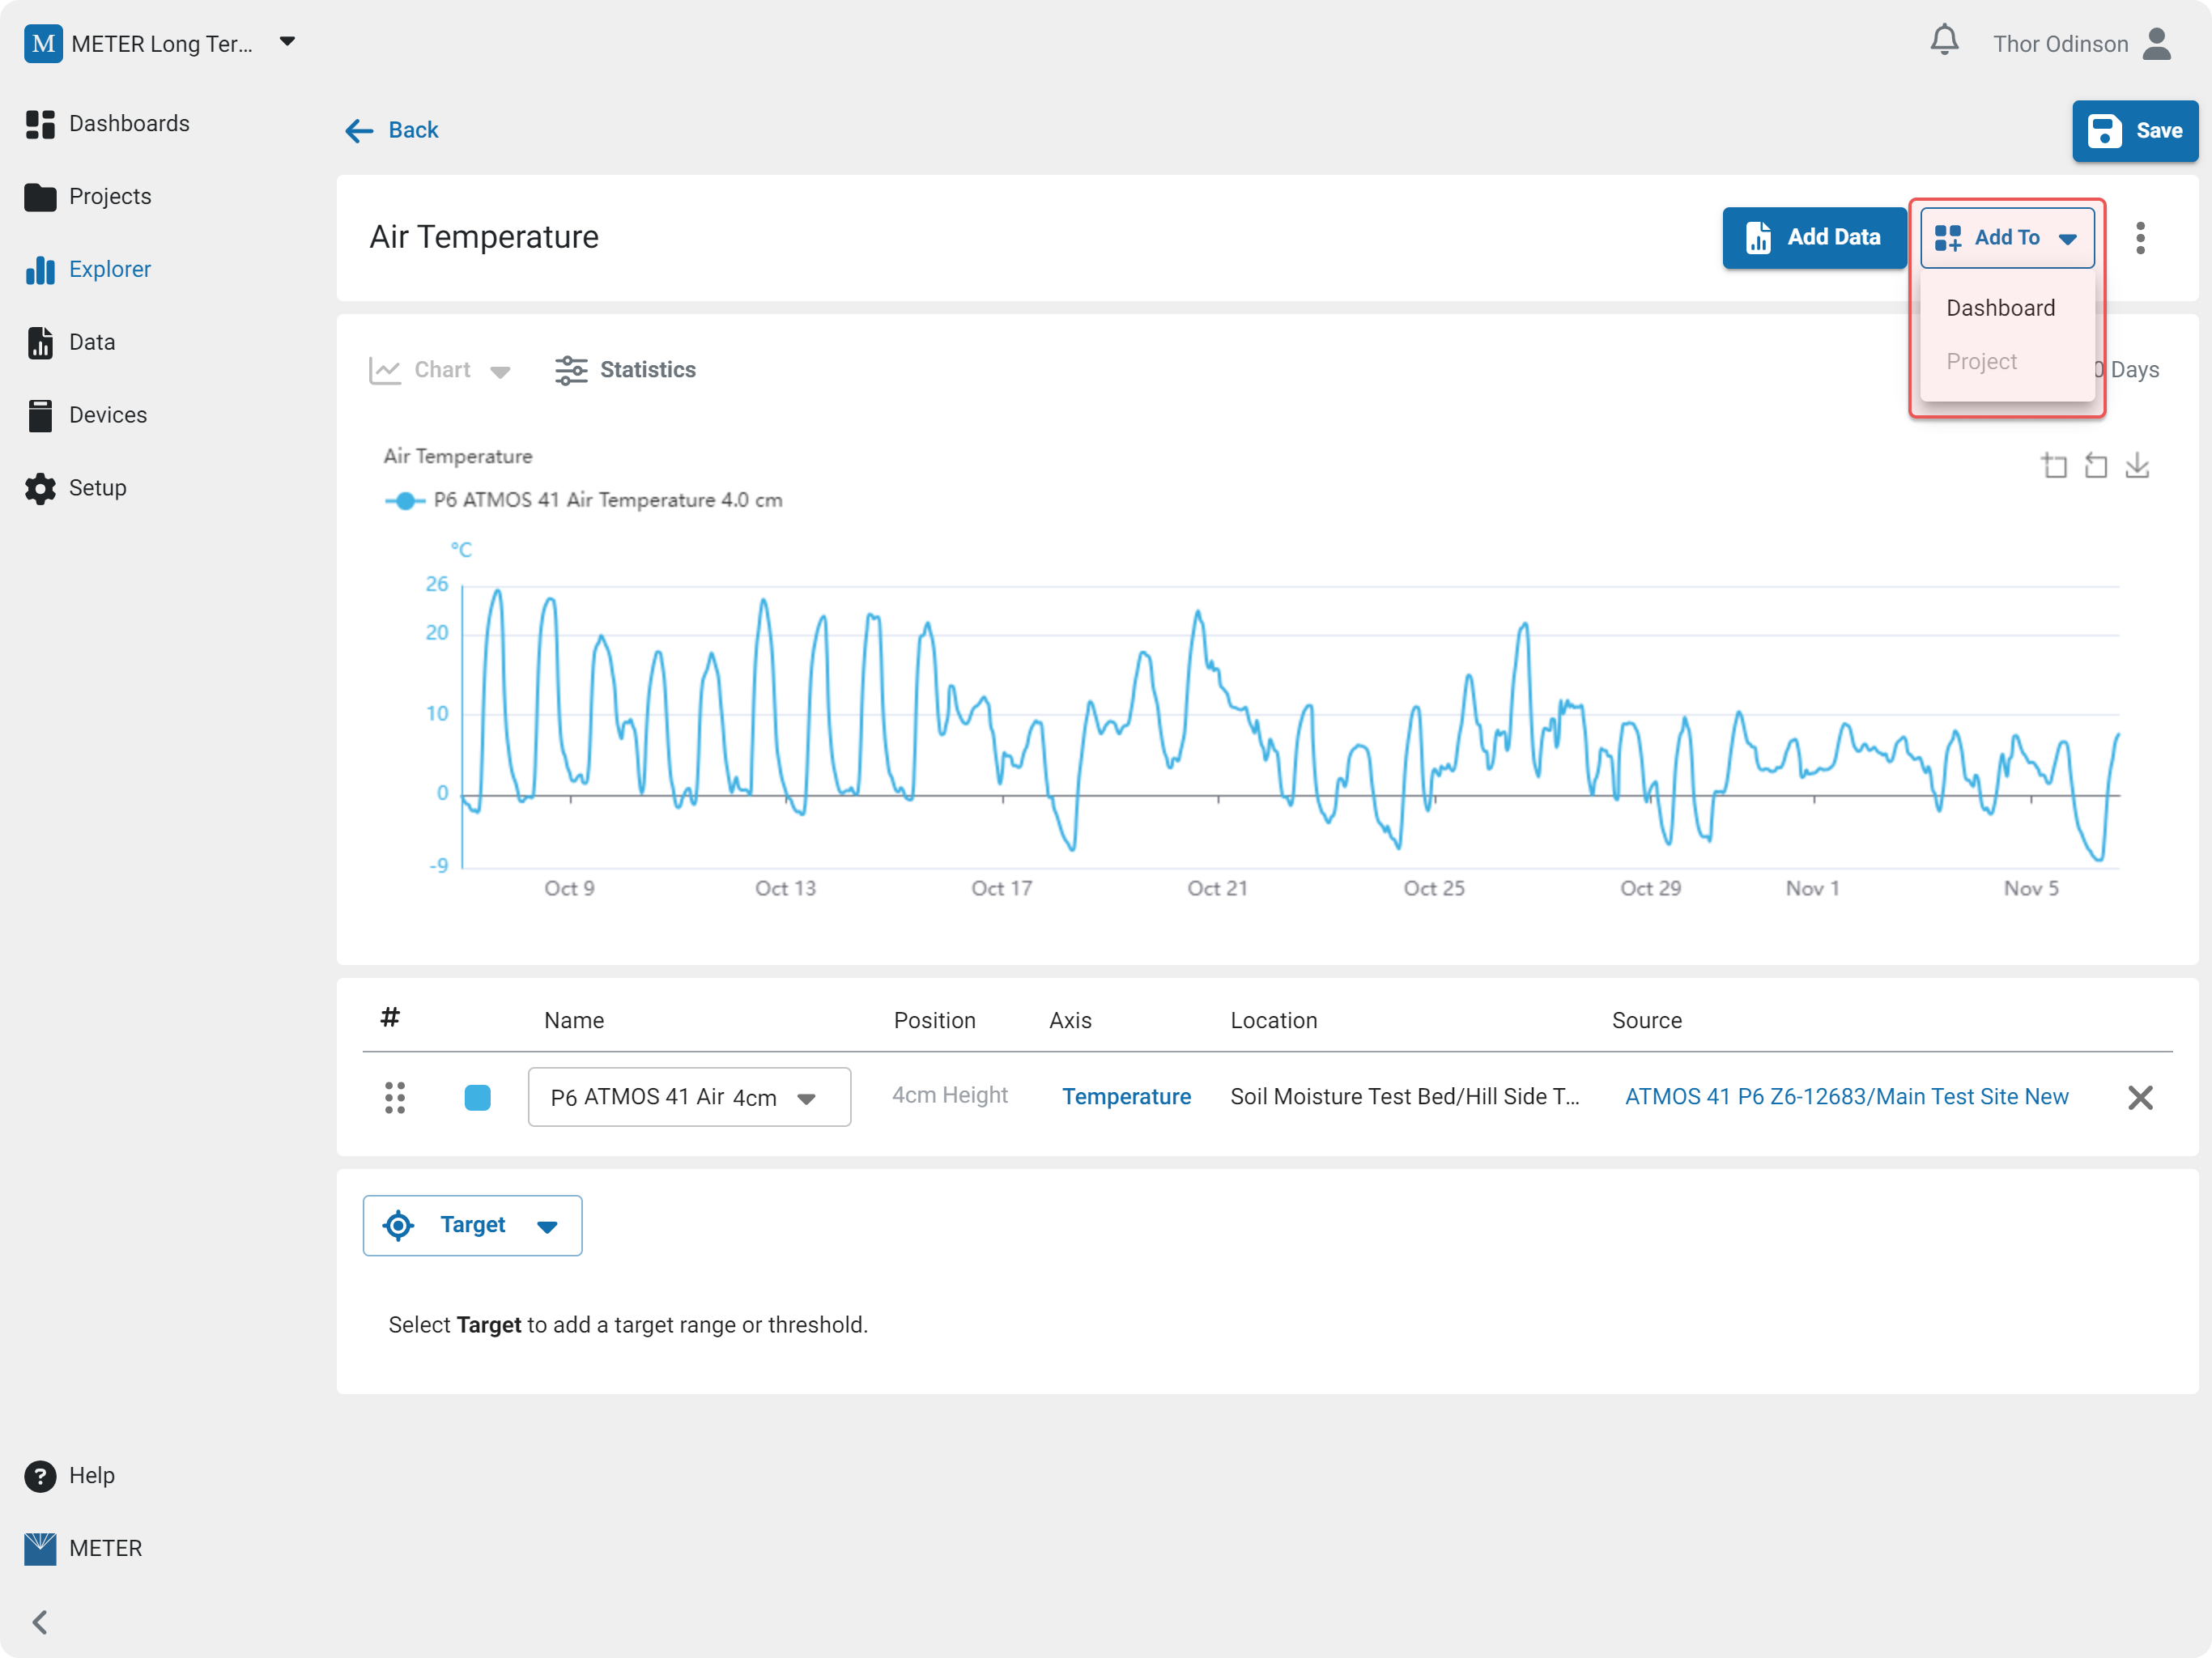
Select Add To to add the graph, table, or map to a workspace or dashboard.
How-To-Video
How did we do?
Explorer: Statistics & Metrics