Table of Contents
Explorer: Statistics & Metrics
How to add summary overviews of your data with statistical metrics.
Table of Contents
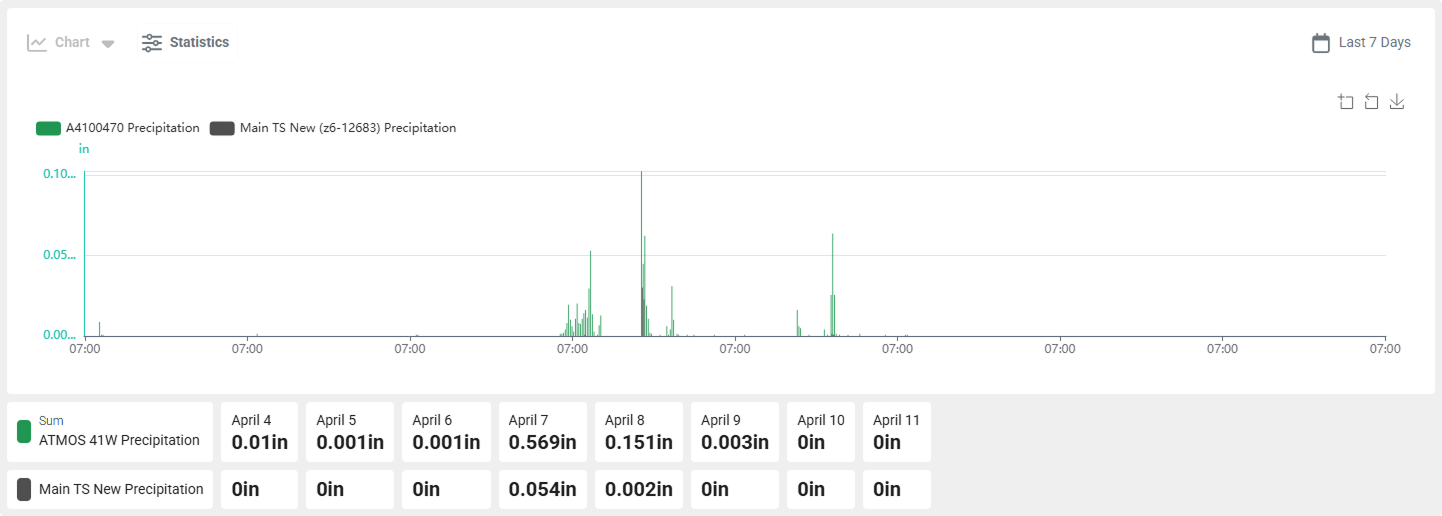
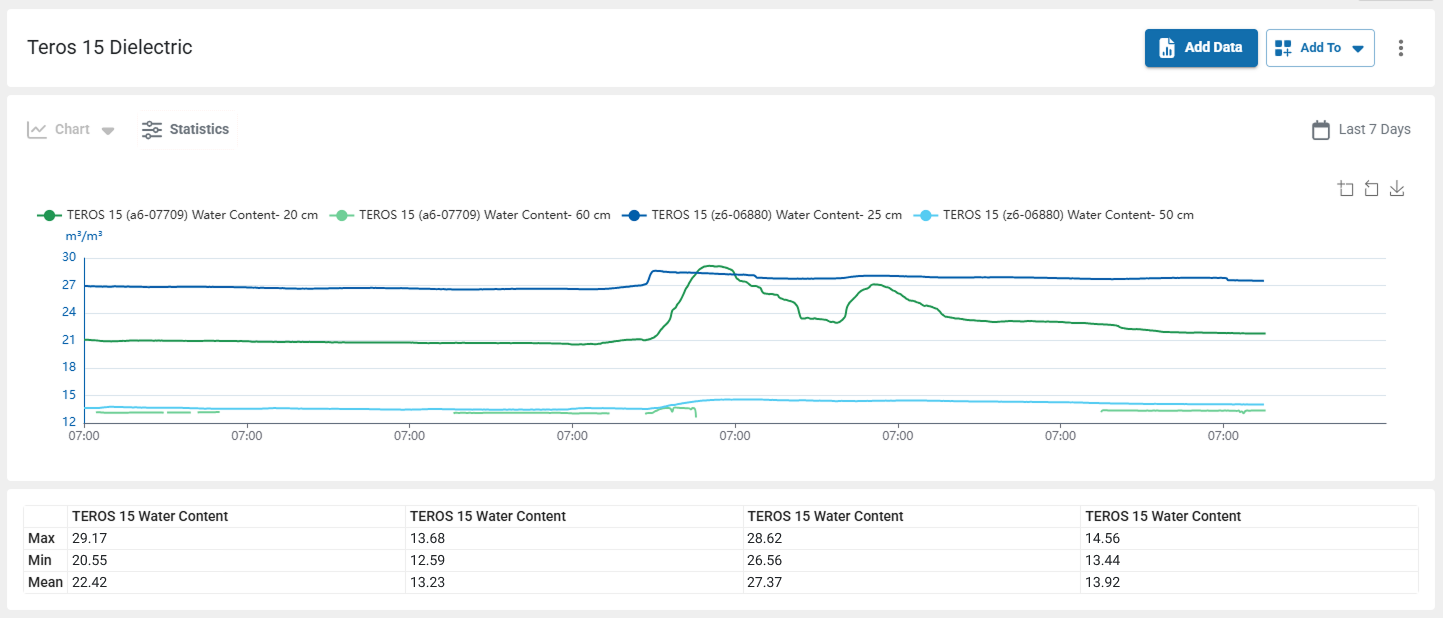
Statistical metrics give you a concise overview of your dataset. You can display them in a table or as a line trace on the graph.
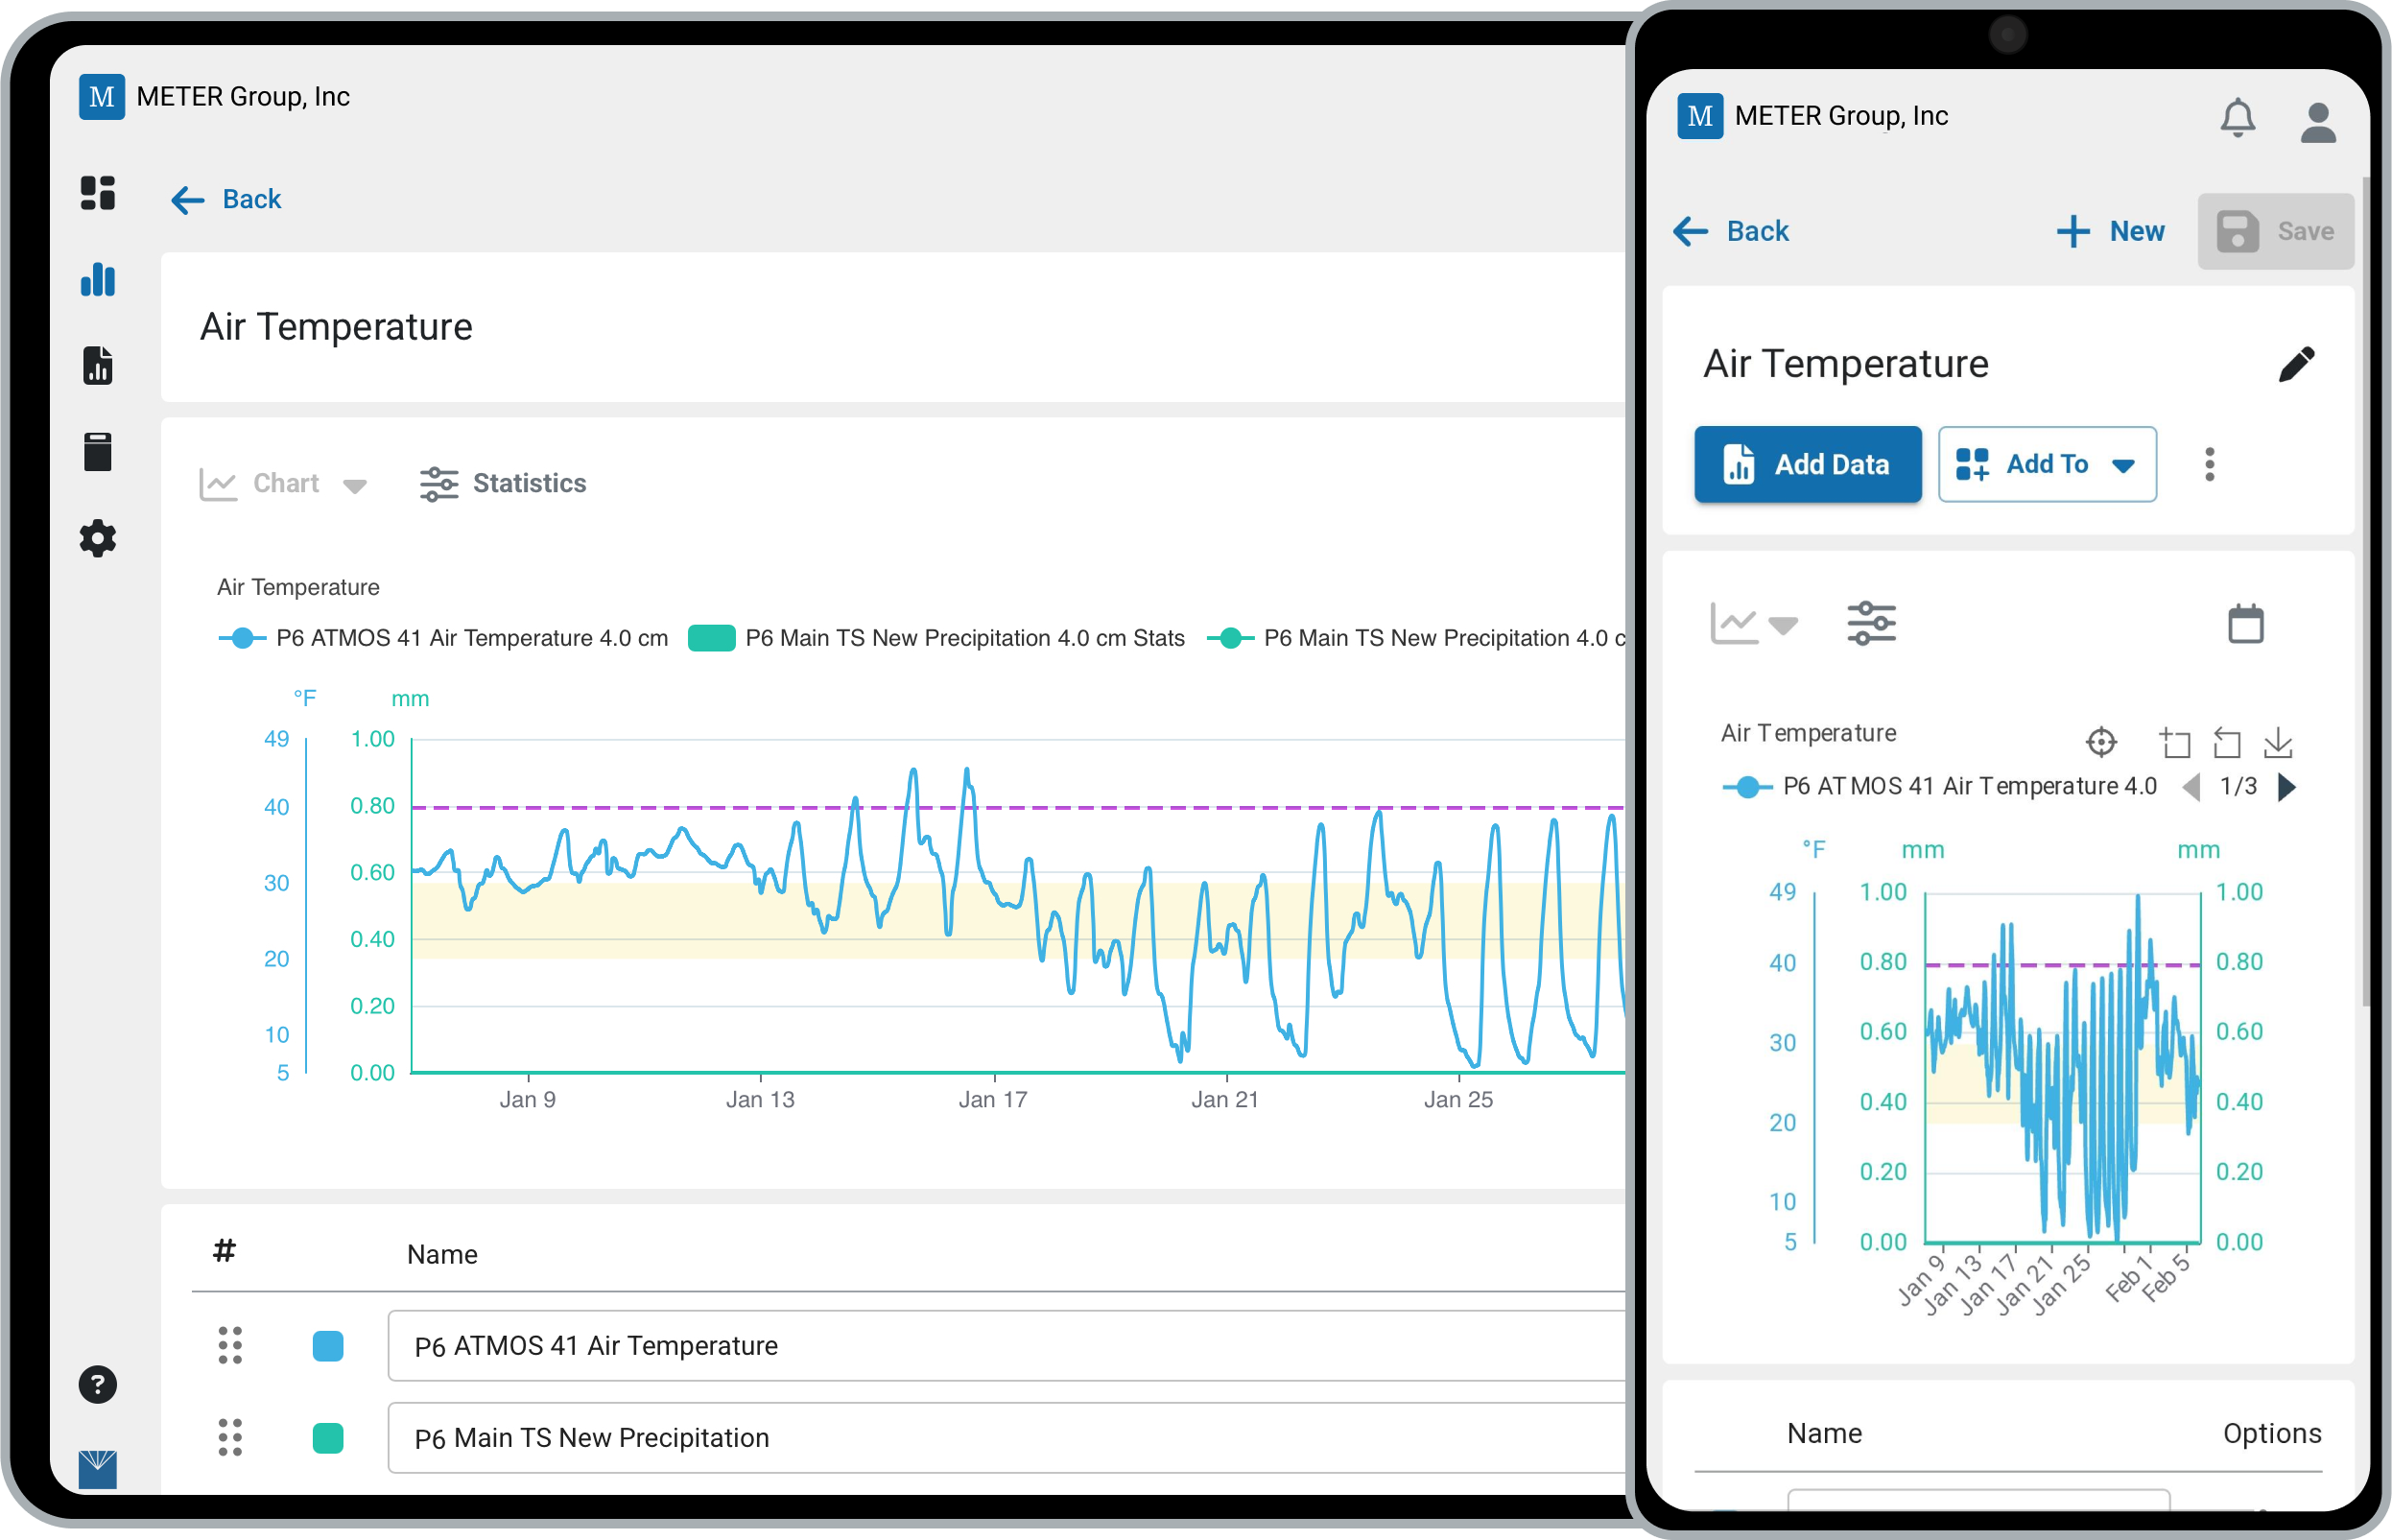
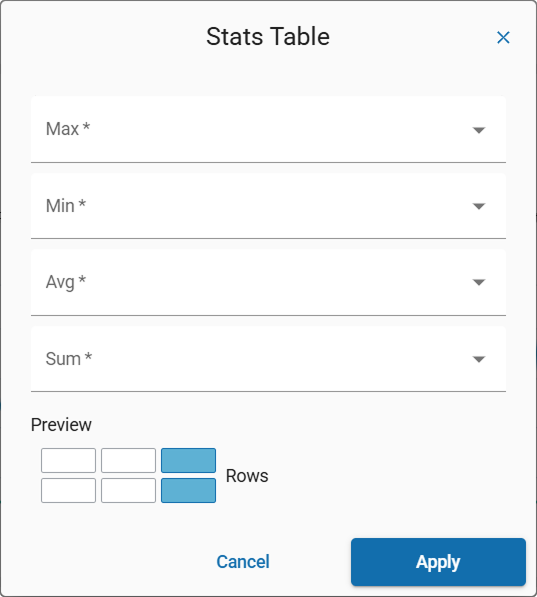
- Table metrics: Max, Min, Avg, Sum
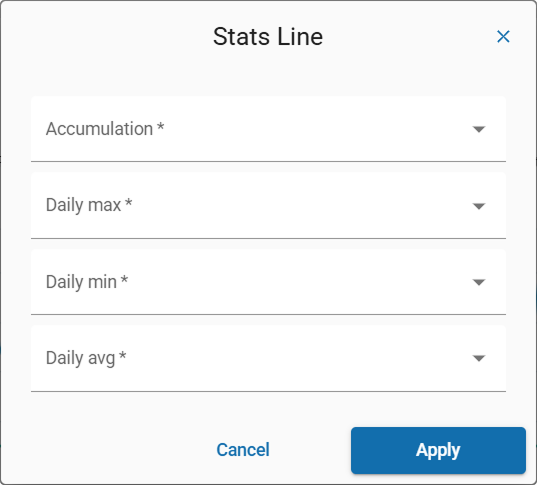
- Line metrics: Accumulation, Daily max, Daily min, Daily avg
Stat data is dynamically aggregated based on the selected time range.
Inline (line) stat data
≤ 14 Days → Aggregated hourly
≤ 90 Days → Aggregated daily
> 90 Days → Aggregated weekly
≤ 14 Days → Aggregated hourly
≤ 90 Days → Aggregated daily
> 90 Days → Aggregated weekly
Table Stat data
≤ 7 Days → Aggregated daily
≤ 30 Days → Aggregated weekly
> 30 Days → Aggregated monthly
≤ 7 Days → Aggregated daily
≤ 30 Days → Aggregated weekly
> 30 Days → Aggregated monthly
Add A Metric
- Click Statistics.
- Select Table or Line for the display option.
- Use the dropdown menus for Max, Min, Avg, or Sum, and check the box next to each measurement you want to display.
- Click Apply.
Stat Rows
Stat Table
How-To-Video
How did we do?
Explorer: Build a Custom Graph
Explorer: Targets