Table of Contents
Getting Started with zentraR
Getting Started with zentraR — Install and authenticate the zentraR package, list devices, download readings as a tidy data frame, and keep a local store in sync.
Table of Contents
zentraR is an R client for the ZENTRA Cloud v5 API. It handles authentication, pagination, and time-window formatting, and returns readings as a tidy data frame ready for dplyr and ggplot2.
This article covers the full workflow: authenticating, discovering your devices, downloading readings, reshaping them, and keeping a local copy up to date.
1. Installation
Before you start
You need two free programs installed:
- R — the statistics language (cran.r-project.org)
- RStudio Desktop — a friendly interface for R (posit.co/download/rstudio-desktop)
Install R first, then RStudio. Open RStudio for the rest of this guide — every command below is typed into the Console (the panel on the left, at the > prompt).
Install from CRAN (recommended)
zentraR is on CRAN, so one line installs it and its dependencies:
install.packages("zentraR")Install the development version (optional)
For the newest in-development version, install from GitLab:
# One-time: the remotes helper
install.packages("remotes")

# Install the latest zentraR:
remotes::install_gitlab("meter-group-inc/pubpackages/zentraR")
To pin a specific version instead of the latest:
remotes::install_gitlab("meter-group-inc/pubpackages/zentraR@v0.1.0")Visit the zentraR project page in Gitlab
Install from a download file (alternative)
Use this if you can't reach CRAN or were sent the package file directly.
Save the package file
Download zentraR_0.1.1.tar.gz and save it somewhere with no spaces in the path, e.g.
C:/Users/<your-username>/zentraR_0.1.0.tar.gz
Install the dependencies from CRAN:
install.packages(c("httr2", "cli", "rlang", "tibble", "tidyr", "vctrs"))Install the package file (use forward slashes):
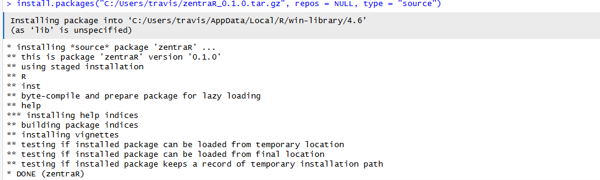
install.packages("C:/Users/<your-username>/zentraR_0.1.0.tar.gz", repos = NULL, type = "source")When it works, the Console ends with `* DONE (zentraR)`.
Load zentraR
Load the package (do this once per R session)
library(zentraR)
2. Authenticate
zentraR reads your token from the ZENTRACLOUD_API_KEYenvironment variable. zc_set_key() sets it for you:
# This session only:
zc_set_key("your-api-token")

# Persist to ~/.Renviron so every future session finds it automatically:
zc_set_key("your-api-token", install = TRUE)
If you already set ZENTRACLOUD_API_KEY yourself — in ~/.Renviron or elsewhere in your environment — skip zc_set_key() entirely.
3. Discover your devices
zc_list_devices() returns one row per device your token can access. Pagination is handled for you; all pages are fetched and combined.
devices <- zc_list_devices()
devices
expand attaches additional detail. Pass one or more values as a character vector.
zc_list_devices(expand = c("max_min_timestamp", "settings"))"max_min_timestamp" is useful before a backfill: it reports each device’s first and last measurement time, so you can choose a sensible start.
expand values and the fields each one adds, see GET List Devices.4. Download readings
zc_get_readings() returns a tidy long data frame — one row per (port, measurement, timestamp). Give it a device ID and a time window.
readings <- zc_get_readings("z6-00930", start = Sys.Date() - 7)
readings
start and end accept a Date, a POSIXct, epoch seconds, or an ISO 8601 string. Values supplied without a timezone are interpreted as UTC.
zc_get_readings(
  "z6-00930",
  start = as.POSIXct("2026-05-01", tz = "UTC"),
  end   = as.POSIXct("2026-06-01", tz = "UTC")
)
units and direction map directly to the corresponding query parameters:
zc_get_readings("z6-00930", start = Sys.Date() - 1, units = "imperial", direction = "descending")Working with error codes
Each row carries an error_code. zc_label_errors() joins human-readable labels onto a readings data frame, and zc_error_codes() returns the lookup table:
zc_label_errors(readings)
zc_error_codes()
The tidy long format works directly with the tidyverse:
library(dplyr)
library(ggplot2)

readings |>
  filter(measurement == "Air Temperature", error_code == 0) |>
  ggplot(aes(datetime, value)) +
  geom_line() +
  labs(y = unique(readings$unit[readings$measurement == "Air Temperature"]))
5. Reshape to wide format
zc_pivot_wider() produces one row per timestamp and one column per measurement — the familiar spreadsheet layout.
zc_pivot_wider(readings)
The wide form drops the per-reading unit and error_code columns. Keep the long form when you need either.
6. Keep a local copy up to date
zc_sync() records what you already have and fetches only newer readings. A store determines where that data lives:
zc_store_rds()— native R files, one per device. Types round-trip exactly; best inside an RStudio project.zc_store_csv()— plain CSV, one per device. Most accessible to collaborators and non-R tools.store = NULL— return-only. Fetches and hands back the data without persisting it, for loading into your own database.
store <- zc_store_csv("data/zentra")

# First run — backfill from `start`, or from each device's first measurement if omitted:
zc_sync("z6-00930", store = store, start = Sys.Date() - 30)

# Later runs — only what's new since last time:
zc_sync("z6-00930", store = store)

# Every device your token can access, in one call:
zc_sync(store = store)

# Read the accumulated record back into R:
all_data <- zc_store_read(store)
With a store, zc_sync() returns a per-device summary (rows added, latest timestamp, status). With store = NULL it returns the combined new readings instead.
zc_sync() paces itself against the API's limits. Readings are rate limited per device, so syncing many devices does not consume a single shared allowance — but if another integration polls the same devices, you share their budgets. See Rate Limiting.Next steps
To run syncs automatically — on project open, daily, or weekly — see Scheduling Automatic Syncs.
How did we do?
Scheduling Automatic Syncs