Pull ZENTRA Cloud data into Excel
Pull ZENTRA Cloud sensor data into Excel through the v5 API. Setup, refresh, what the columns mean, and the limits to know before you rely on it.
Pull sensor data from the ZENTRA Cloud v5 API into an Excel workbook — no macros, no add-in, and nothing for IT to approve.
How it works
The ZENTRA Cloud Excel template is a standard .xlsx workbook built on Power Query, Excel's built-in data connection tool. You paste a v5 API key into the workbook, choose the devices and date range you want, and refresh. Excel calls the v5 API directly and loads the readings into the workbook's Data Model, where you explore them through a PivotTable.
Nothing is installed. The workbook holds the connection and the settings; you hold the API key.
This is a pilot. It works and is in use, but it is early, and the v5 API underneath is still settling. If you work in Google Sheets instead, zentracloud-sheets is the equivalent template for that platform — the Excel template is a counterpart to it, not a replacement.
- Check that your Excel will run it
Confirm all of the following before you download the workbook.
- Excel for Windows, 64-bit — Microsoft 365, or Excel 2019 or newer. 64-bit is not optional. Readings load into the Data Model, and the 32-bit build cannot hold enough of them to be useful. To check which build you have, open File → Account → About Excel and read the version line.
- Excel for the web will not work. It cannot refresh this type of connection at all.
- Excel for Mac is untested. It may work; we have not verified it, and we cannot support it.
- Get your v5 API key
In ZENTRA Cloud, go to User Account → Integrations and select Show Token. Copy the key. If you have not made one before, API Token covers it in full.
Treat the key like a password. It grants access to the data of every device your account can read.
- Download and open the workbook
Download the workbook from the link below. It always points at the current release, so the same link works for every version.
Open it in Excel. The workbook contains no macros, so you will not see a macro security prompt. If Excel opens the file in Protected View, select Enable Editing.
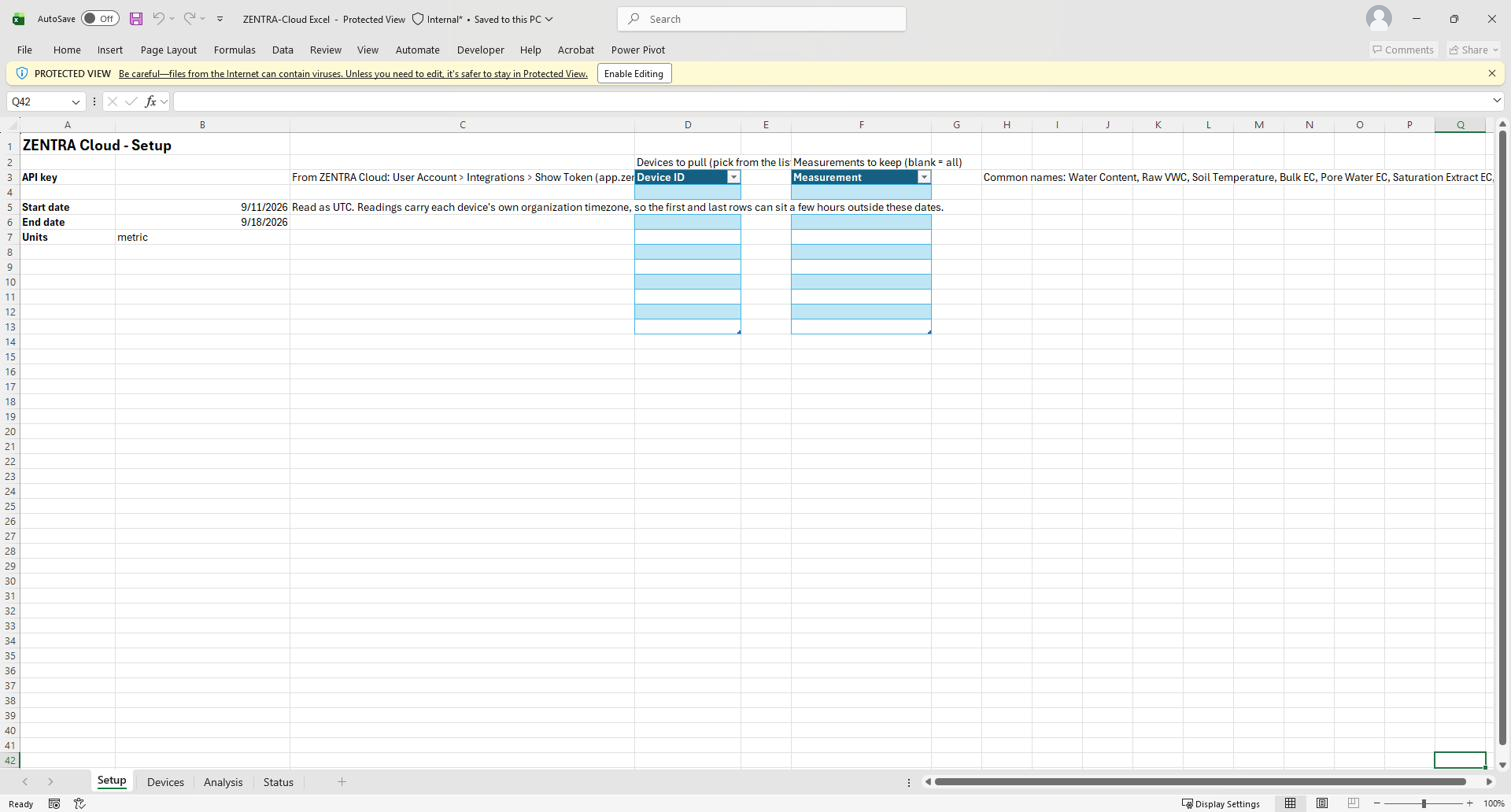
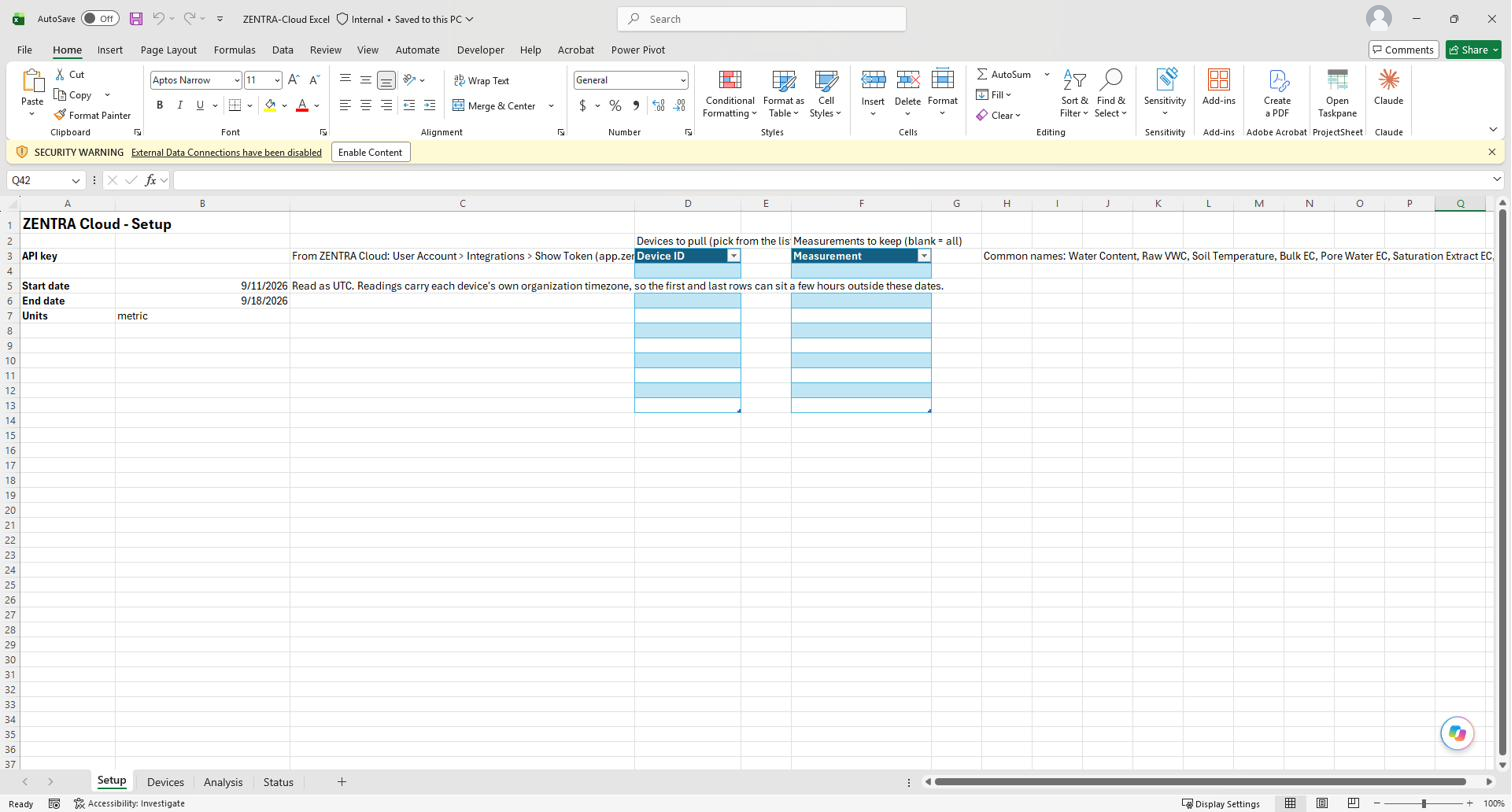
After you enable editing, Excel shows a second bar: SECURITY WARNING External Data Connections have been disabled. Select Enable Content. Until you do, a refresh will not reach the API.
- Add your API key
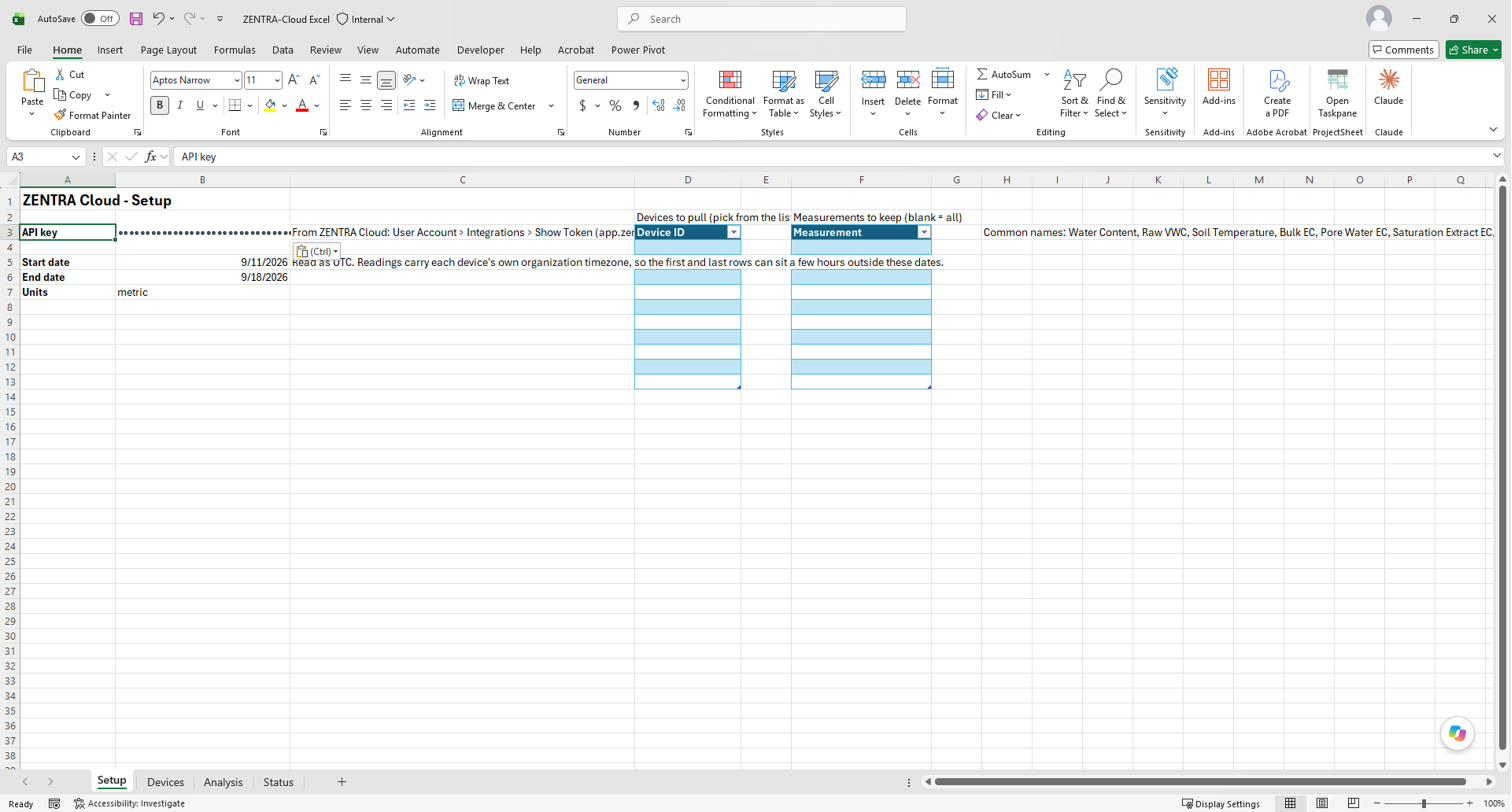
On the Setup sheet, paste your key into the cell next to API key.
The key is stored inside the workbook file. Anyone you send the file to can read it and use it. Clear the API key cell before you share the workbook with anyone.
- Connect to ZENTRA Cloud
Go to the Devices sheet, right-click anywhere in the table, and select Refresh.
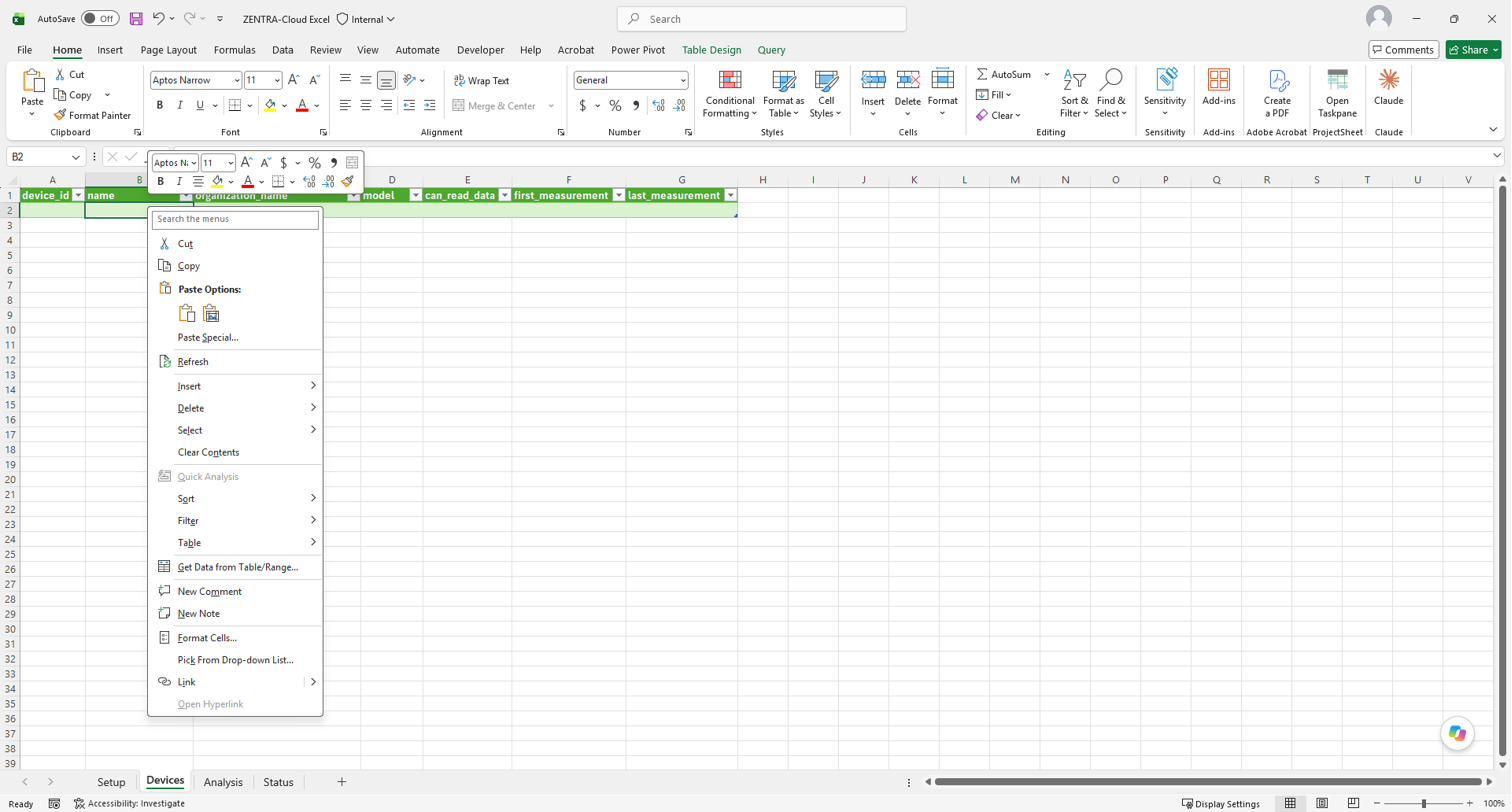
The first time you do this, Excel asks how it should sign in to api.zentracloud.io. Choose Anonymous and select Connect.
Anonymous looks wrong here, but it is correct. Your API key travels in a request header that the workbook sets for itself — it is not the kind of credential Excel is asking about. Excel only asks once per machine.
The Devices sheet then fills with every device your key can pull data from.
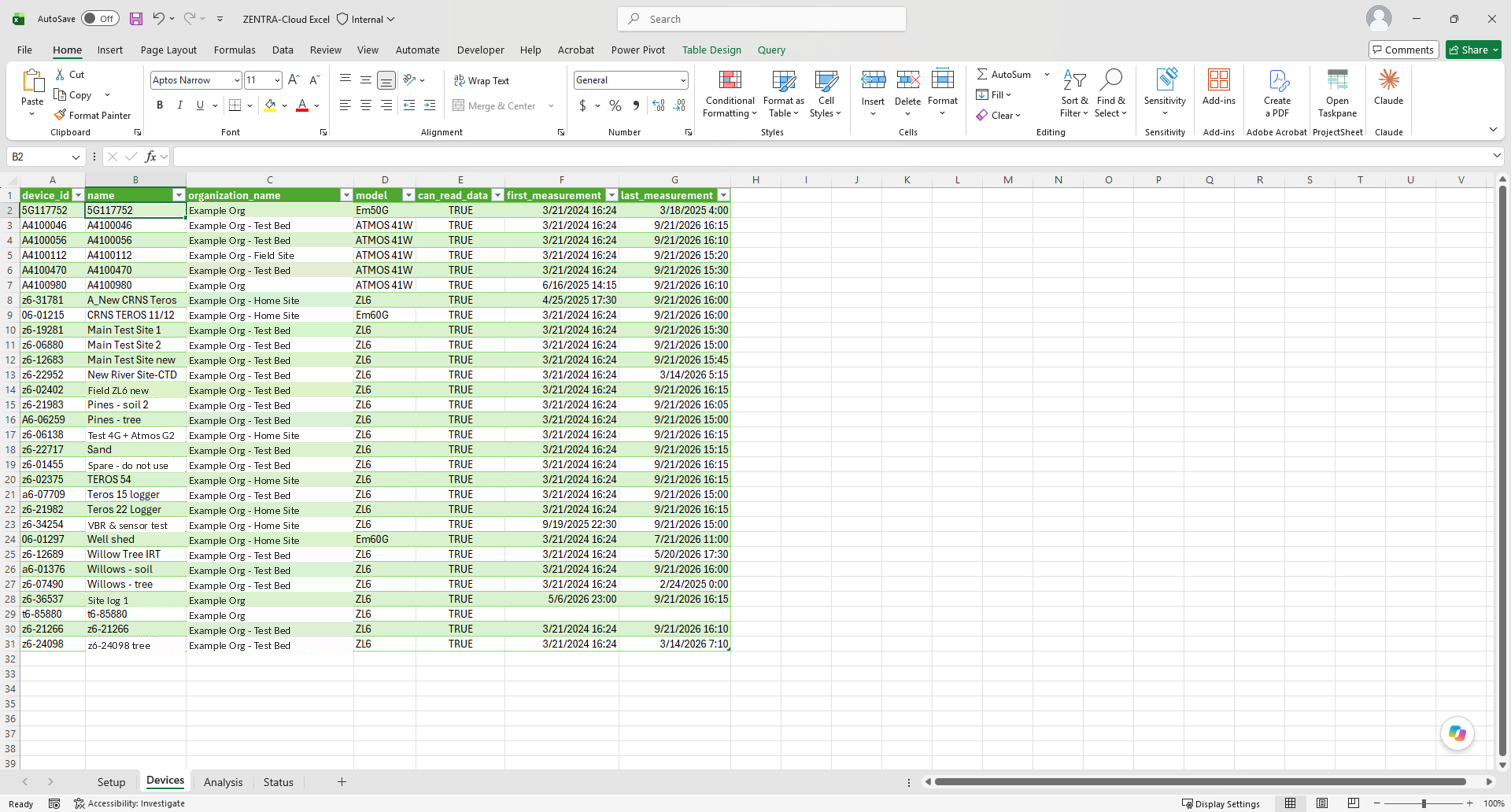
If a device you expect is missing: the sheet lists only devices your account can read data from. An account can see a device in ZENTRA Cloud without holding the role needed to read its data, and those devices do not appear here. If one is missing, ask your organization's administrator to check your role on it.
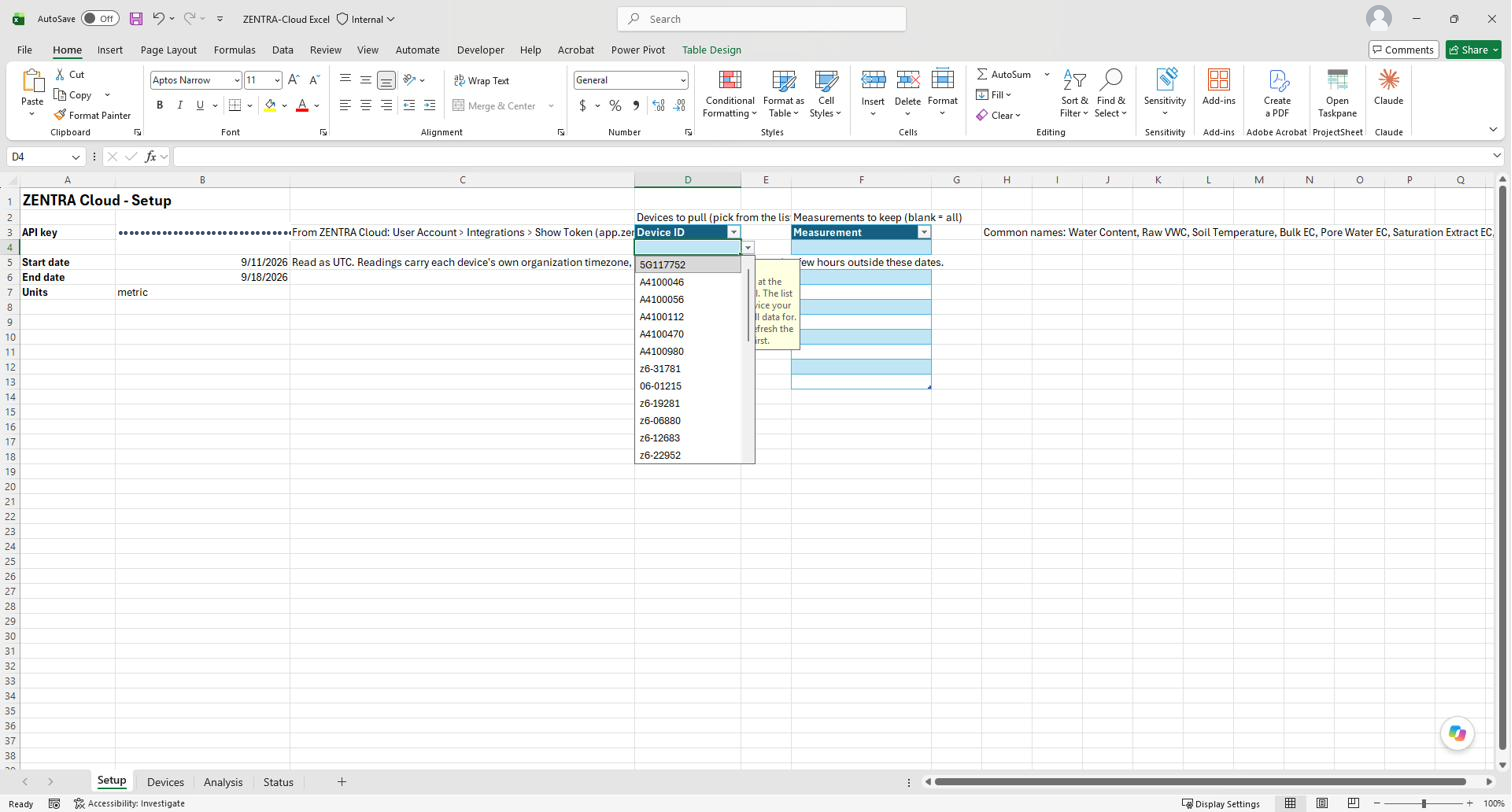
Refresh this sheet before you pick devices on Setup — the Device ID dropdown reads from it, and it is empty until the first refresh.
- Choose devices, dates, and units
Back on the Setup sheet:
- Pick your devices from the Device ID dropdown, under Devices to pull.
- Set Start date and End date. These dates are interpreted as UTC.
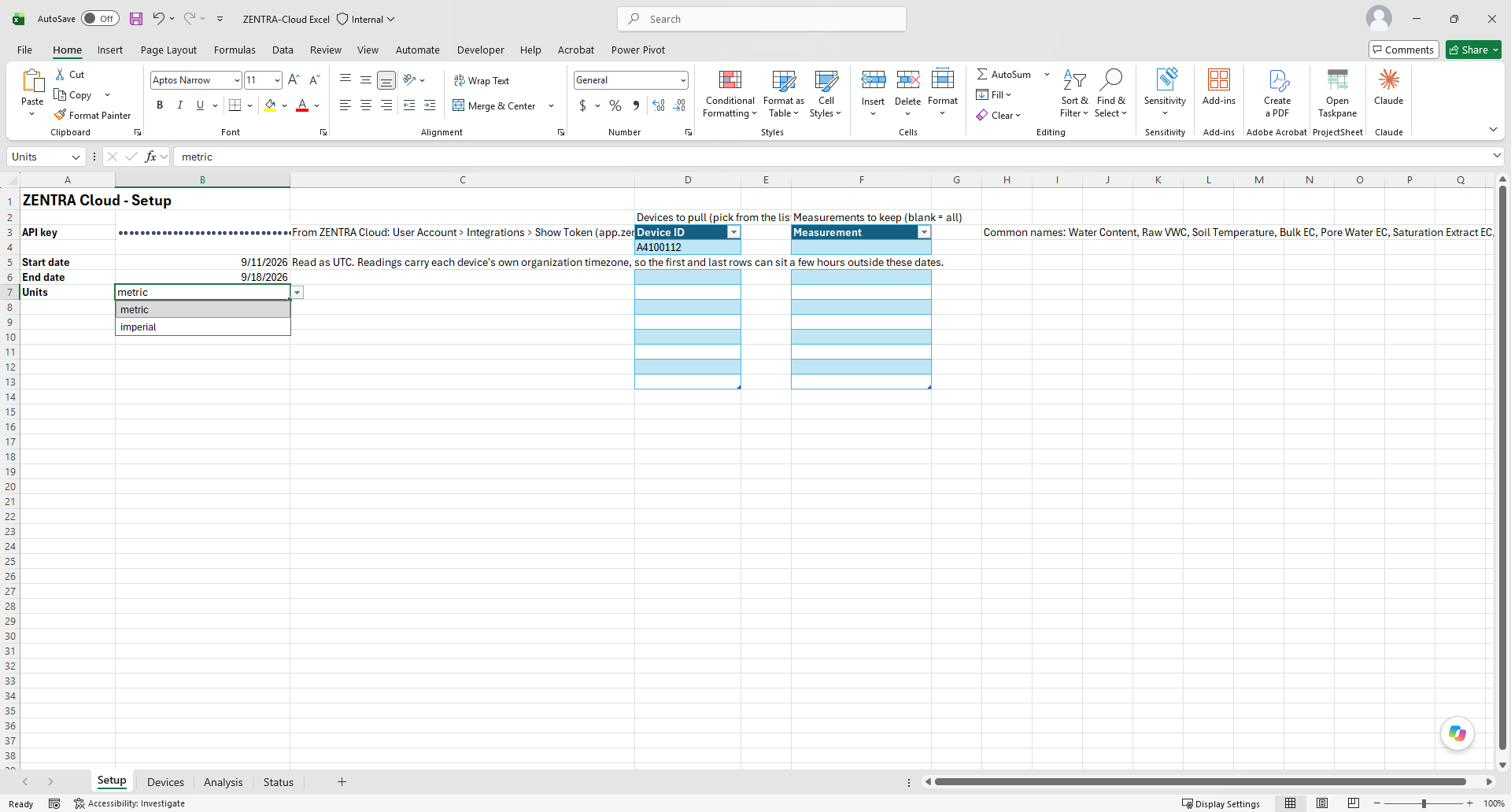
- Set Units to either
metricorimperial.
datetime column. This is expected, not a bug in the window.Optional: to narrow what gets pulled, list the measurements you want under Measurements to keep. Leaving it empty pulls every measurement.
Keep the date range to what you actually intend to use. Every refresh re-pulls the entire window from scratch — there is no incremental refresh that fetches only what is new — so a wide range costs you the same time on every single refresh.
- Refresh and work with the data
Select Data → Refresh All.
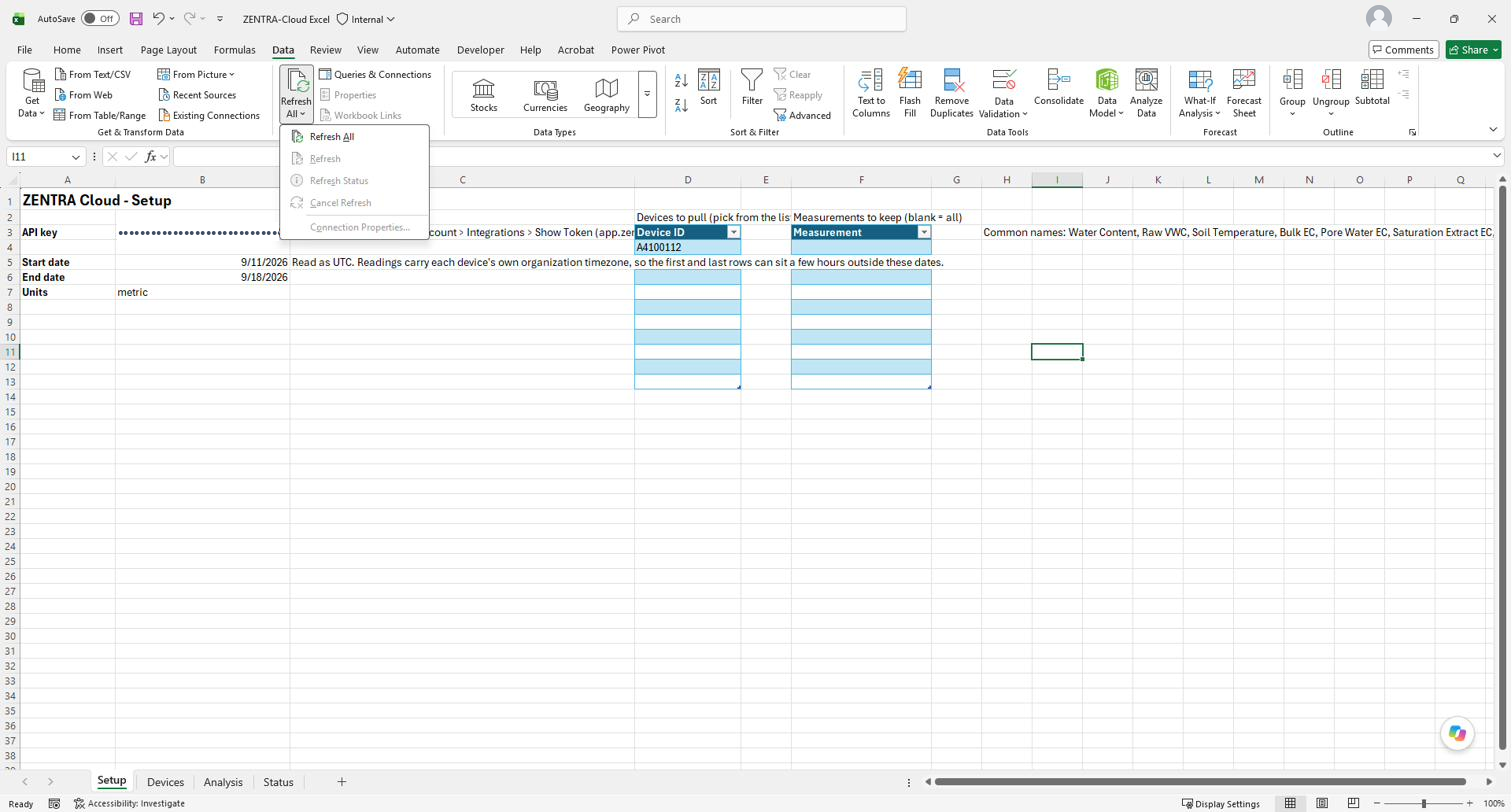
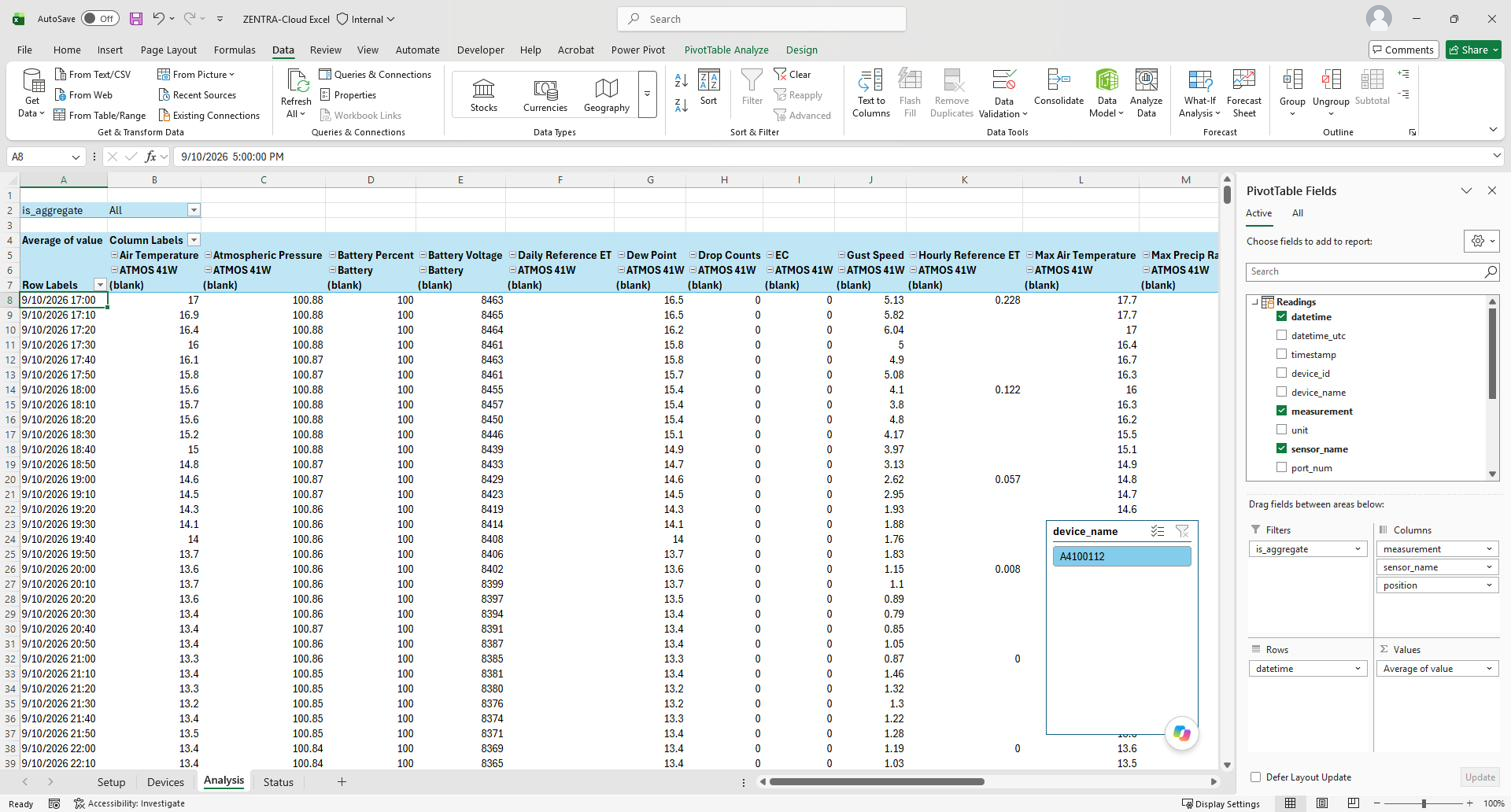
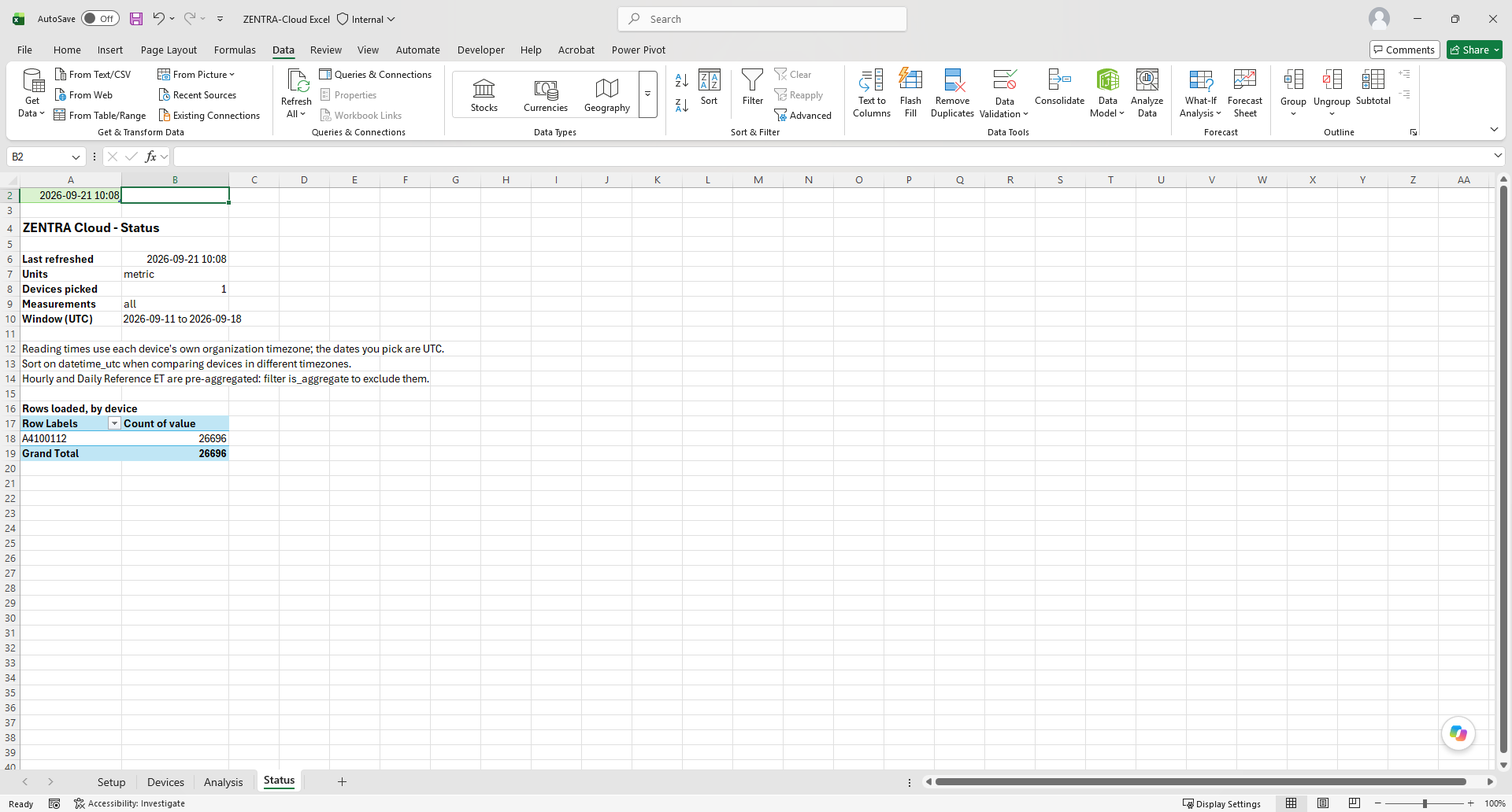
When it finishes, go to the Analysis sheet. This is where you reach the data: a PivotTable of Average of value by datetime, broken out by measurement, sensor and position, with a device_name slicer and an is_aggregate filter at the top. Set that filter to FALSE for most analysis — see What the columns mean below. The Status sheet records what the last refresh actually did: when it ran, the units used, how many devices were picked, whether all measurements or a subset were requested, the UTC window, and a row count per device.
A long pull looks frozen, and is not. Most of the elapsed time is the workbook deliberately waiting between requests to stay inside the API rate limit. As a rough guide: a seven-month window for one device finishes in under seven minutes, and a full year in around twelve. Let it run.
For a large backfill, use a client instead. Several years of history, or many devices at once, will go faster and more reliably through the Python Client (zentracloud) or the R Client (zentraR) than through a workbook refresh.
- What is on each sheet
Sheet | What it holds |
Setup |
|
Devices | Every device your key can pull data from — |
Analysis | The PivotTable and |
Status | What the last refresh did: time, units, number of devices, measurement filter, window, and row counts. |
There is no sheet of raw rows. The readings live in the workbook's Data Model rather than on a worksheet, which is what lets the workbook hold more readings than Excel's limit of 1,048,576 rows per sheet — a single logger on a 15-minute interval produces roughly 4,250 rows per day.
- Build your own view
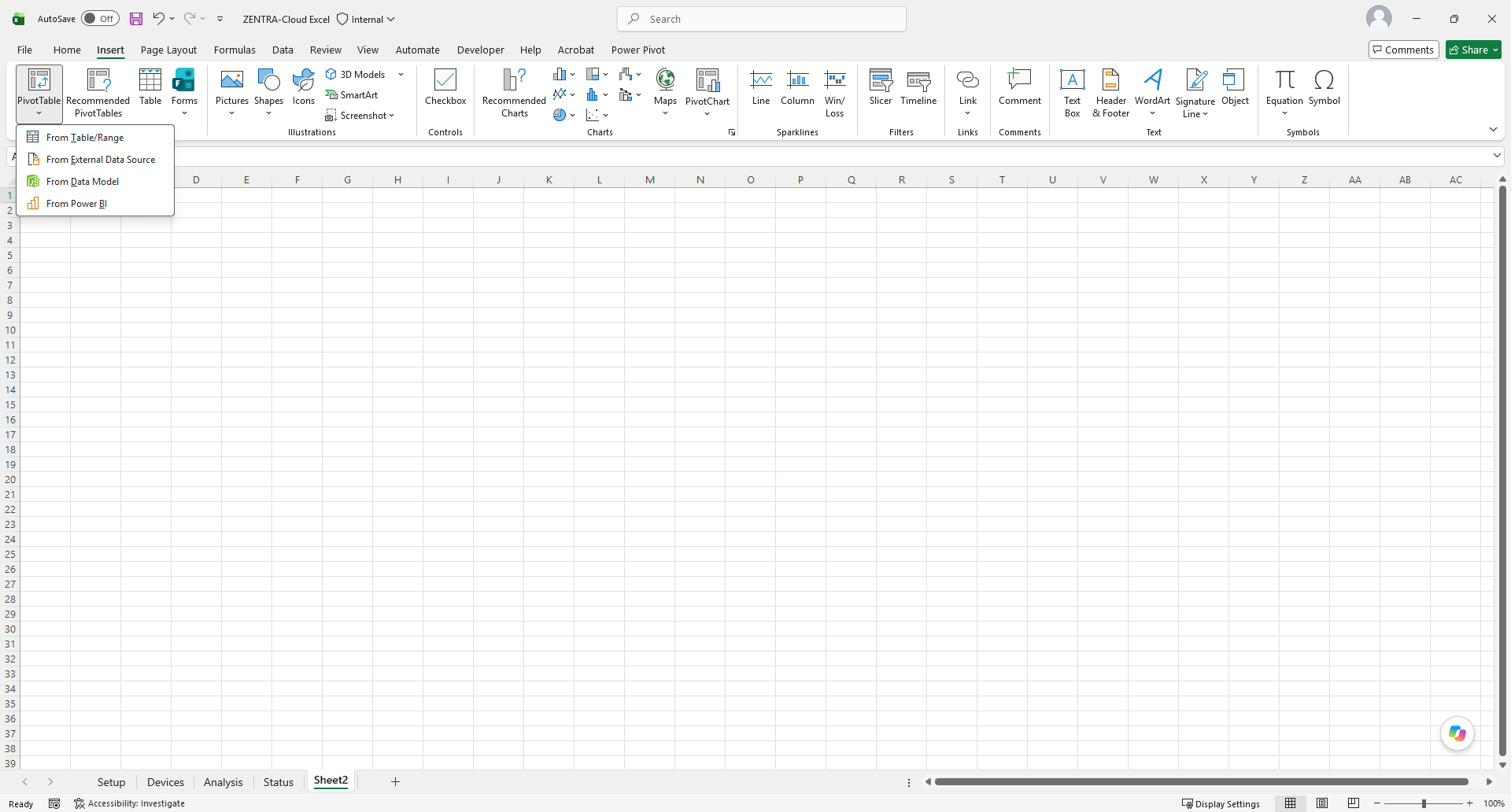
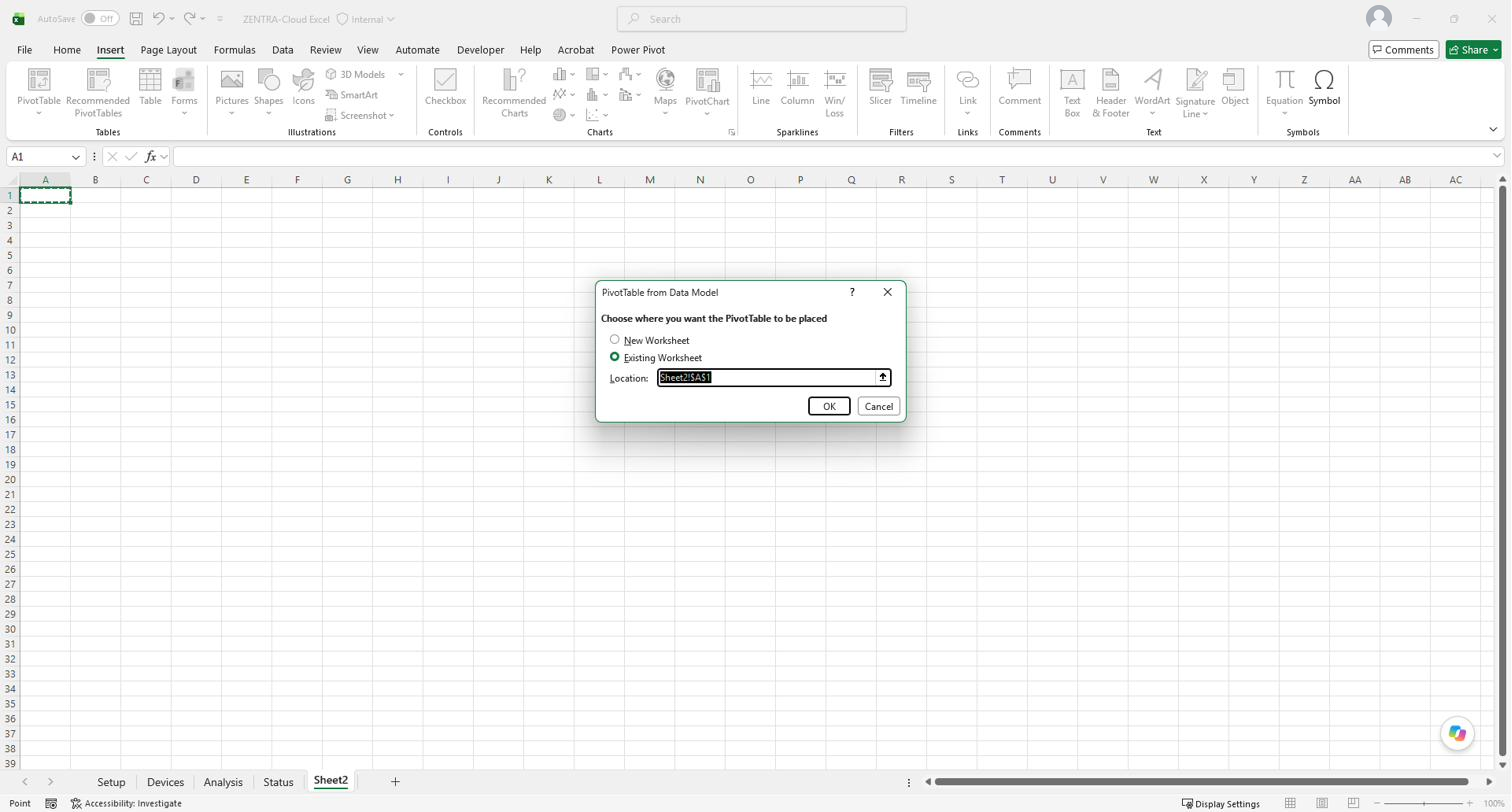
Use Insert → PivotTable → From Data Model, choose where to put it, then pick fields from the Readings table in the field list. The other tables in the list — Devices, DeviceSelection, LastRefresh, Measurements — hold the workbook's own settings, not your readings.
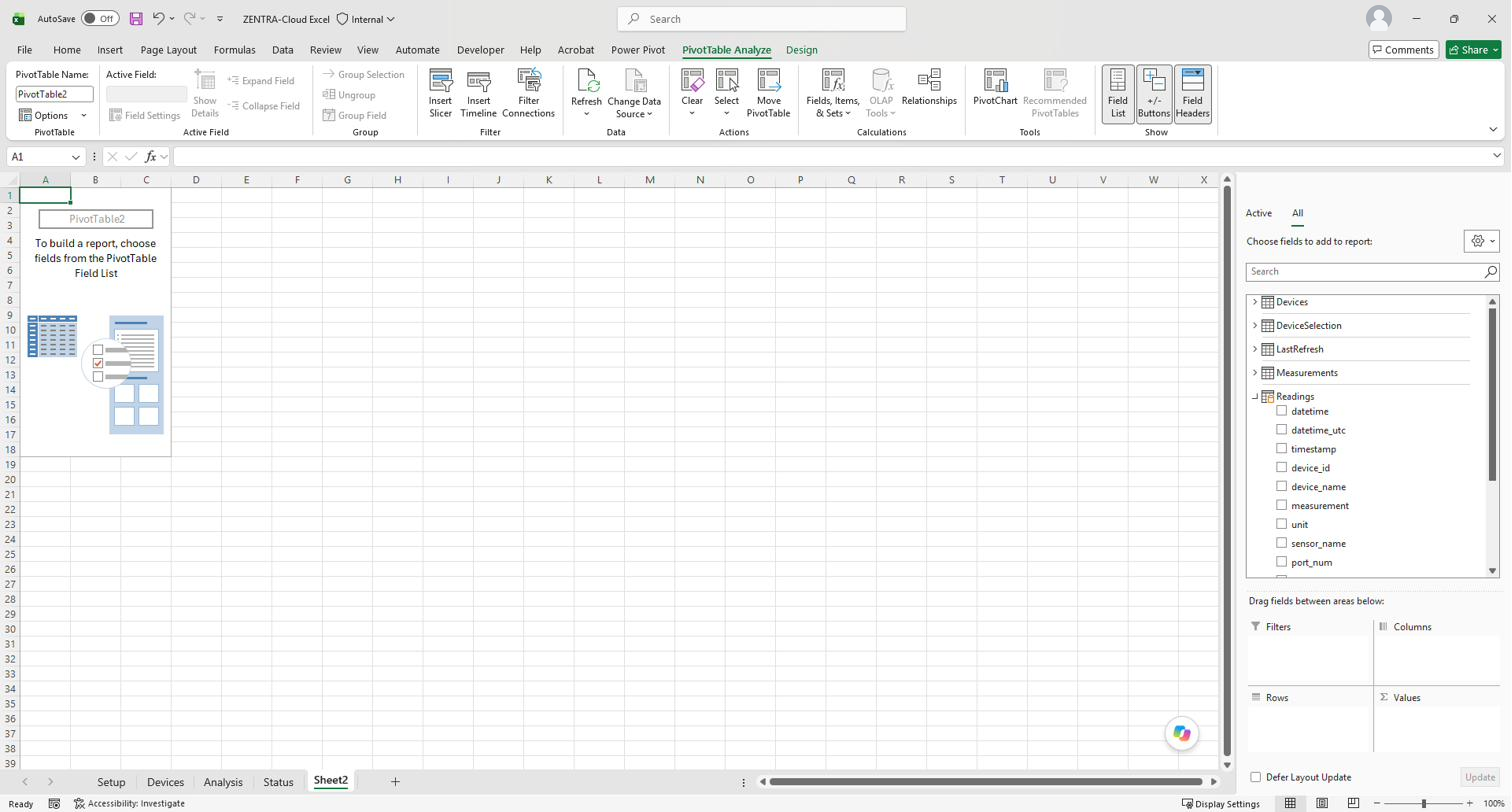
- What the columns mean
Column | What it is |
| Reading time in the device's organization timezone |
| The same reading time in UTC — sort and compare on this one when devices span timezones |
| The reading time as a numeric timestamp |
| The device the reading came from |
| That device's name |
| What was measured |
| The unit the value is in |
| The sensor that produced the reading |
| The port that sensor is connected to |
| Which series on that port — see the note below |
| The reading itself |
| Set when the reading could not be produced normally |
| The reading's identifier in ZENTRA Cloud |
| Whether the row is a pre-calculated series rather than an instantaneous reading |
Filter is_aggregate = FALSE for most analysis. Some series are calculated rather than measured, and arrive at their own cadence — on a 15-minute logger, Hourly Reference ET and Daily Reference ET produce 24 and 1 rows per day where an instantaneous measurement produces 96. Averaging them alongside instantaneous readings gives a meaningless number, and nothing else in the row tells you they are different.
Multi-depth sensors share a port. A TEROS 54 or TEROS 06 returns one series per depth on a single port. position is what distinguishes them.
- Refreshing on a schedule
You can set the workbook to refresh on a timer: Data → Queries & Connections, right-click the query, select Properties.
This only runs while the workbook is open in Excel on your machine. There is no unattended or server-side refresh — closing Excel stops it.
- If a refresh fails
A rate-limit message. Wait a few minutes and refresh again.
The v5 API allows a short burst of requests and then about one per minute. Device lists are limited per user, but readings are limited per device and shared by everyone with access to it — so a colleague pulling the same logger consumes the same budget you do, and you can be throttled by someone else's refresh. On a busy device, a long pull may need two or three attempts before it completes. The data you end up with is correct either way.
A Power Query error that does not name a cause. Check the API key cell on the Setup sheet first. A wrong or expired key produces a generic error that does not point at the key. The refresh does fail rather than quietly returning nothing, so an incorrect key cannot leave you with partial data you would mistake for complete.
Missing older data. Readings older than roughly 914 days are not returned. A Start date earlier than that is silently moved forward rather than refused, so the pull succeeds and simply starts later than you asked. Check the window recorded on the Status sheet against the dates you entered.
- Known issues
- A throttled refresh restarts instead of resuming. When the API throttles a refresh, Excel re-runs the whole query rather than picking up where it stopped — which spends more requests at exactly the moment the budget is tightest. This is why a long pull against a busy device sometimes needs more than one attempt.
- A wrong API key produces a generic error. The message does not name the API key cell.
How did we do?