Lock Chart Axes
Lock the y-axis of any chart on the dashboard. Open the target ranges modal and enter values in the lock axis min and max boxes.
Fix Chart Axes
- Click the vertical ellipsis icon (three dots).
- Select Target Ranges.
- On the Lock Axis row, enter values for the Min and Max.
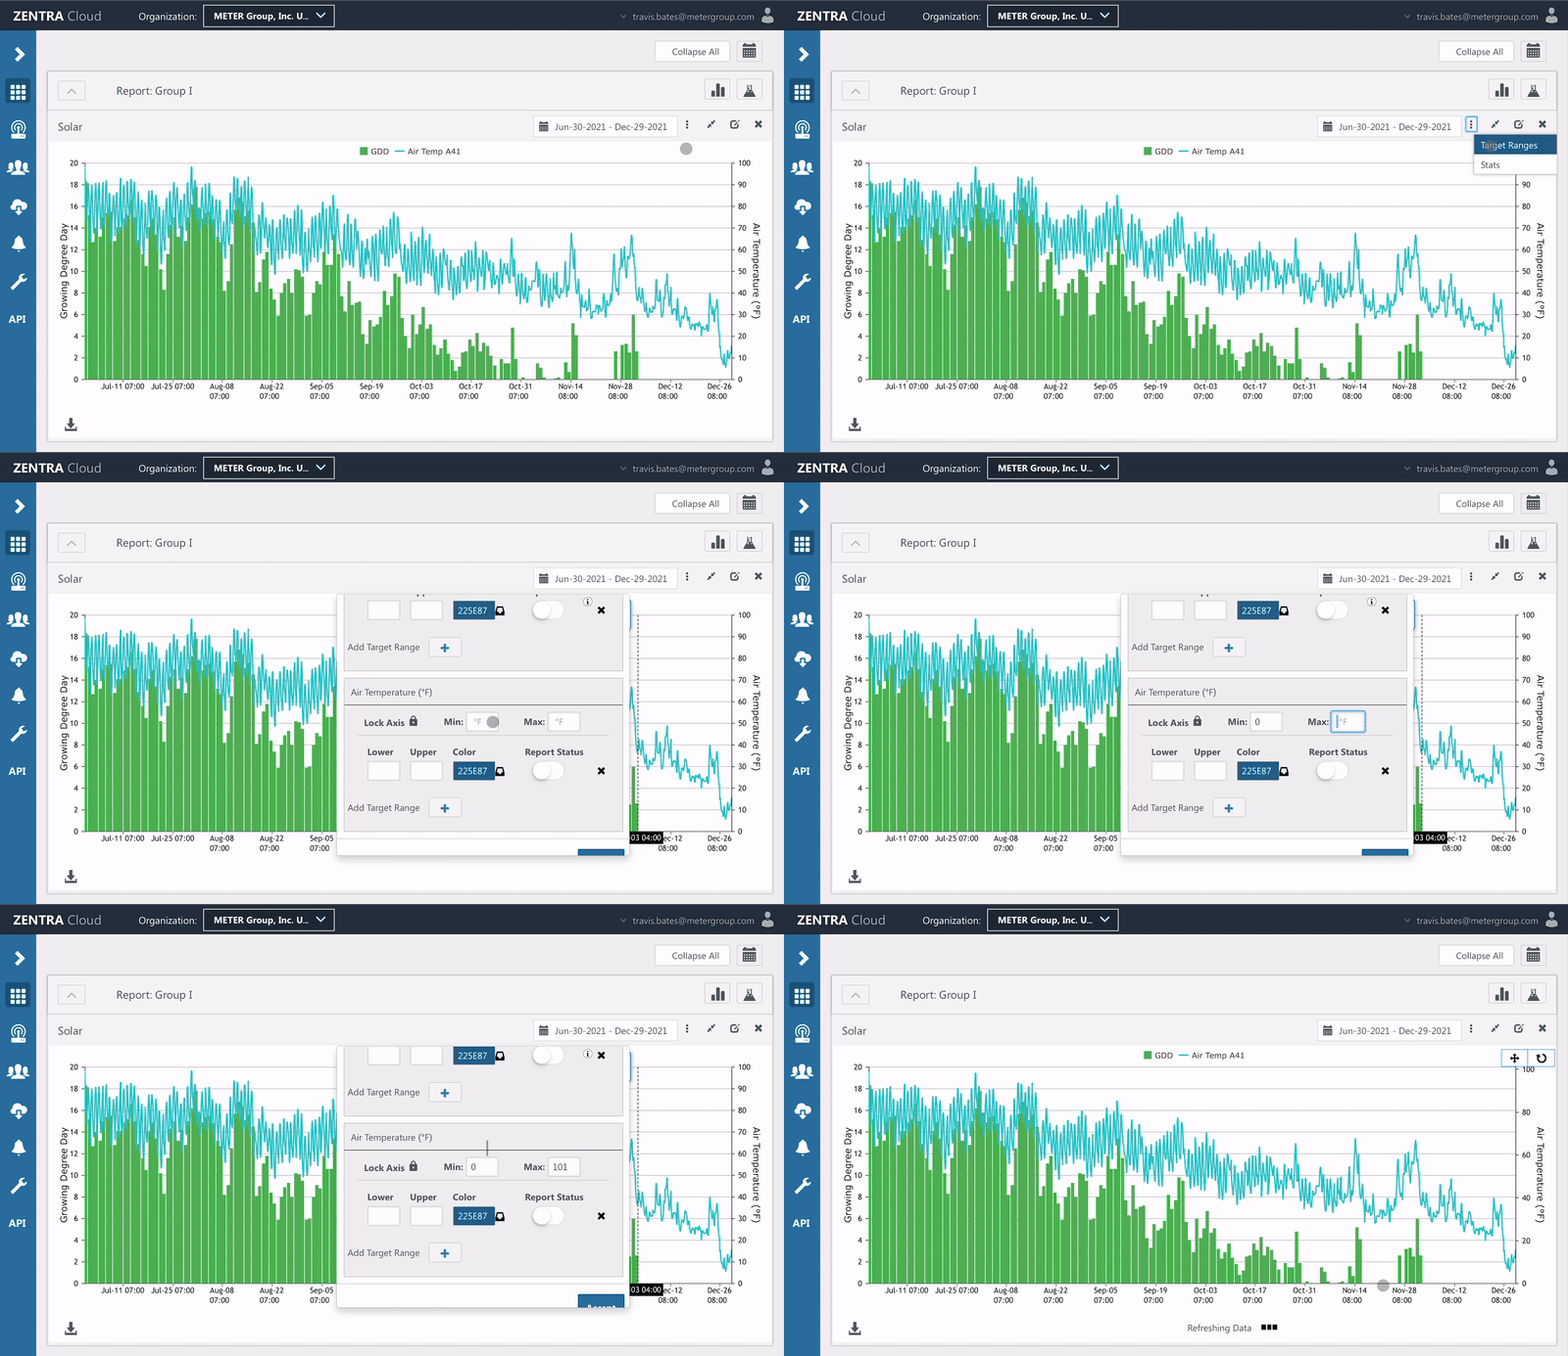
To remove the fixed axis, simply delete the values and save.
How did we do?
Set a Target Range
Chart Date Range Picker [NEW]