Table of Contents
Data Logger Charts
How to view data from a device (e.g., ZL6, ATMOS 41W, etc).
Table of Contents
Device charts display sensor measurement data with interactive controls that let you select time frames, toggle individual traces, and zoom in for detailed analysis.
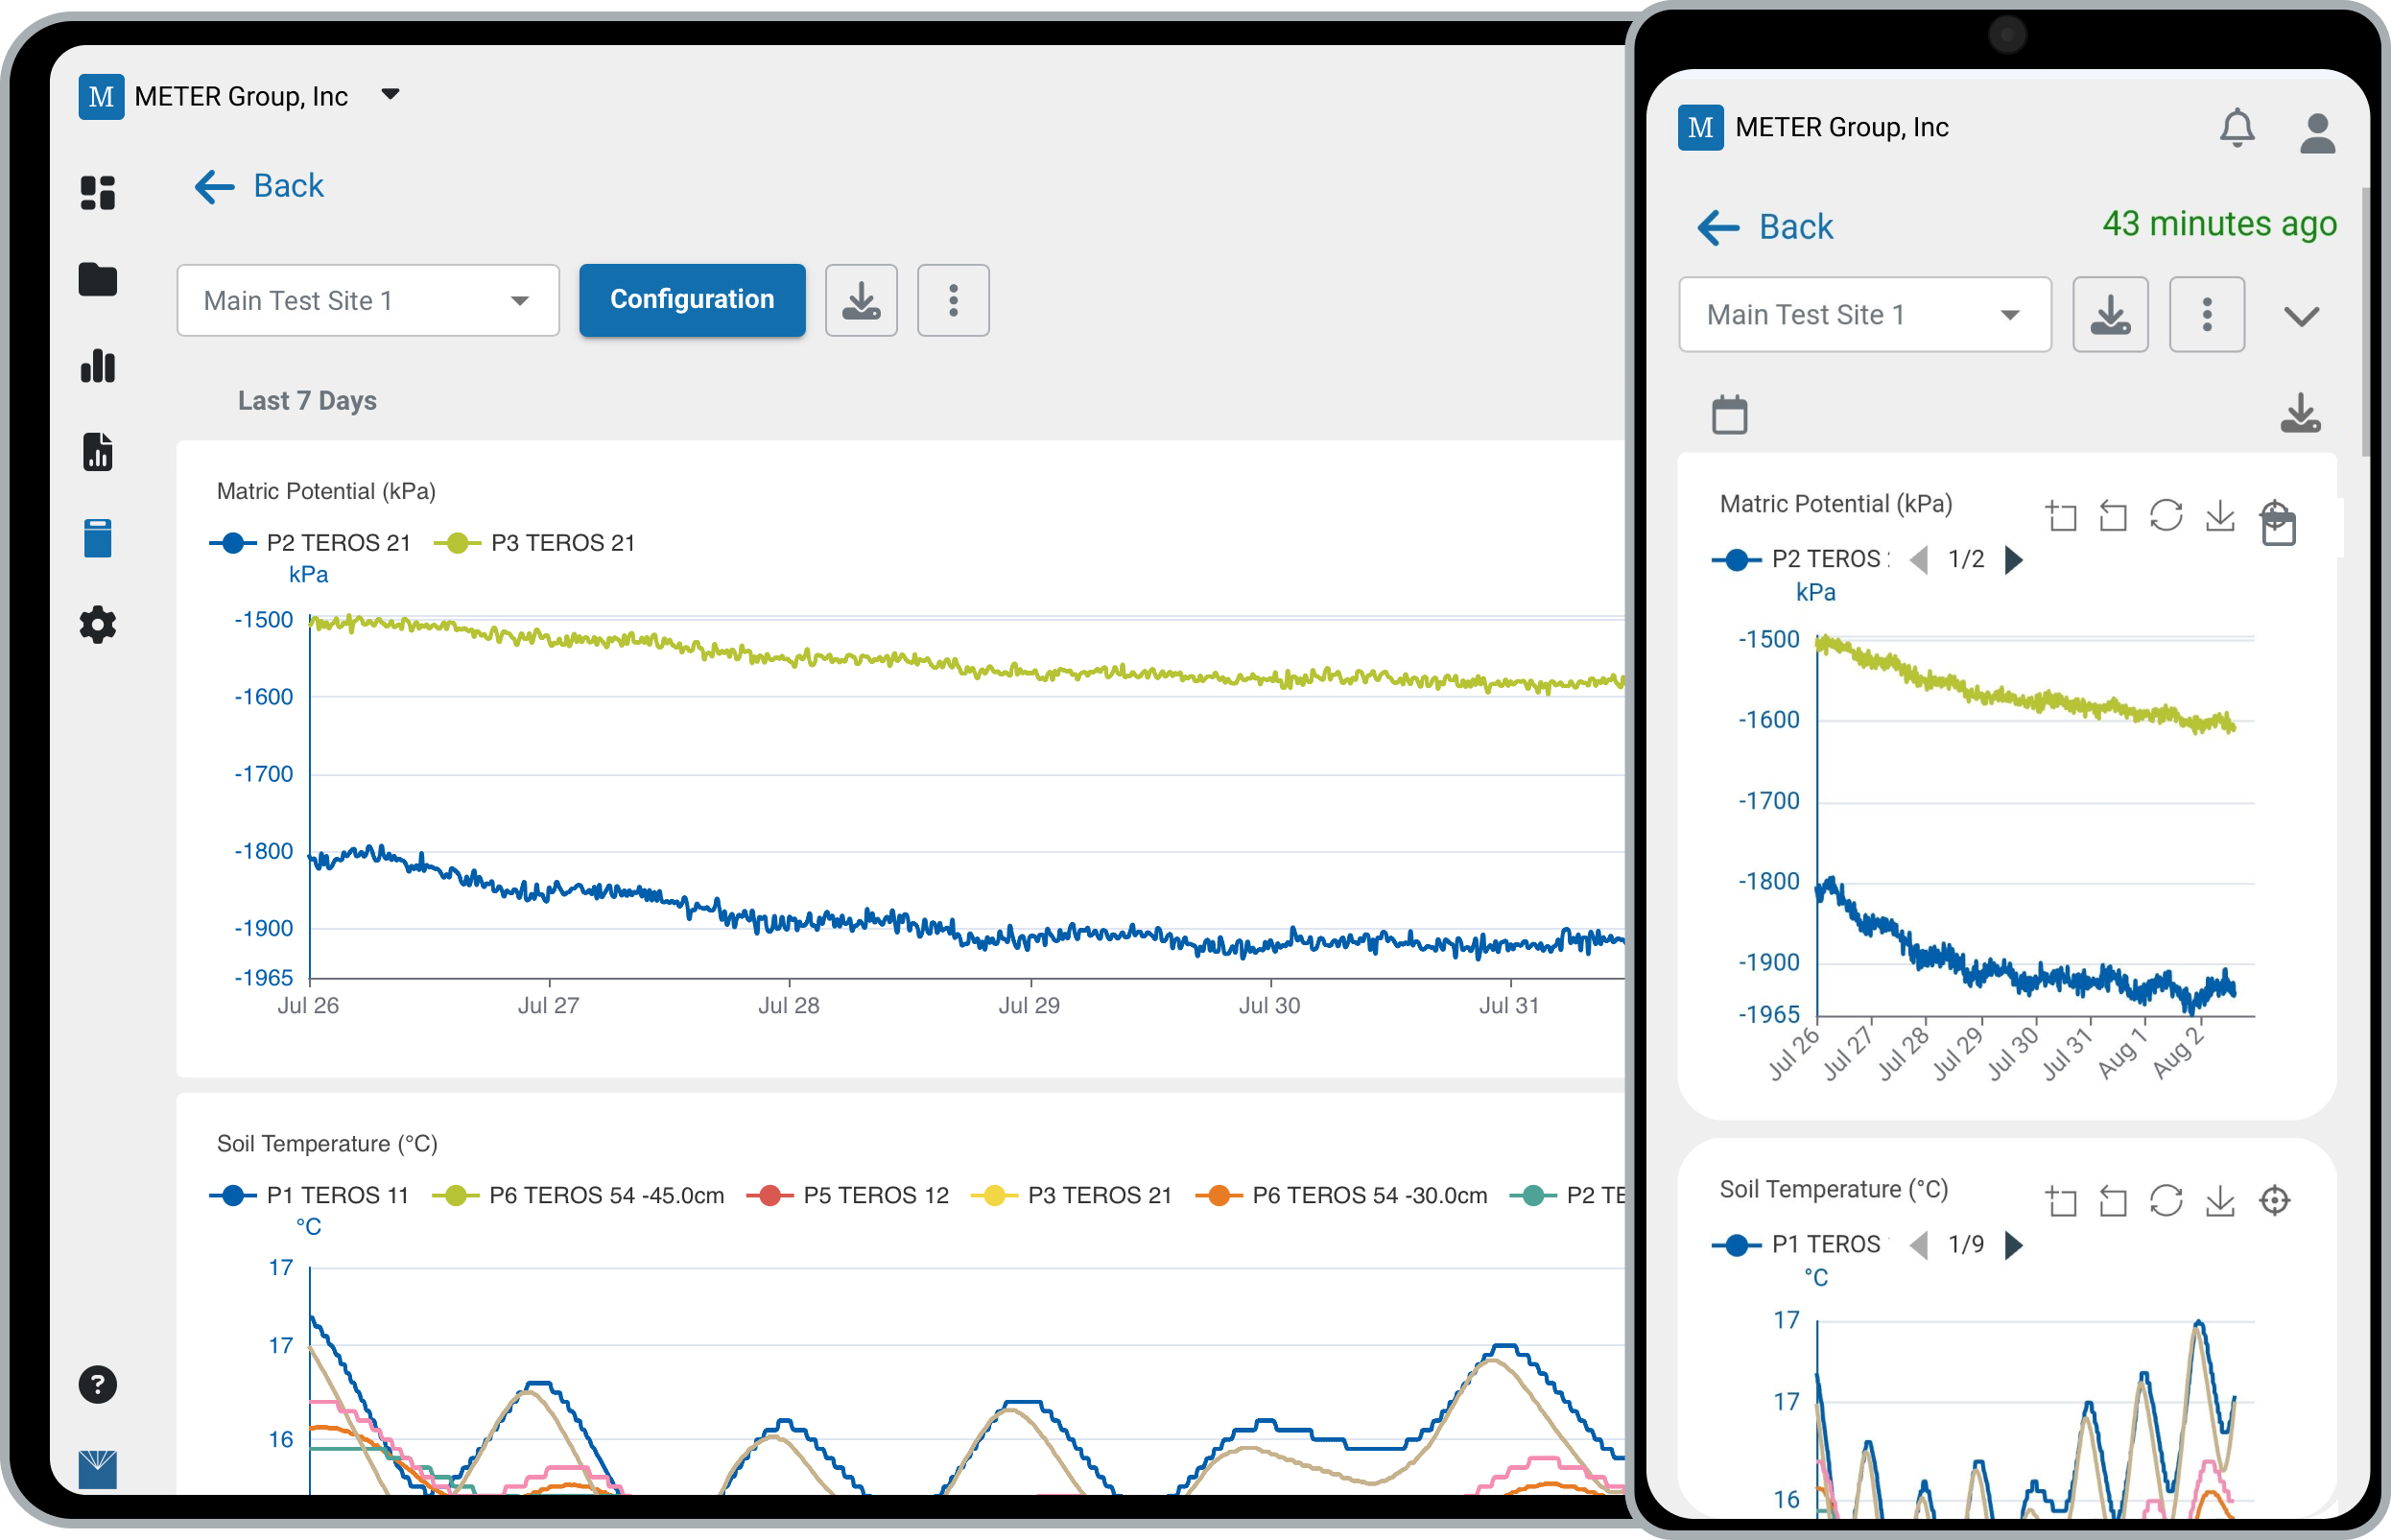
Chart data is dynamically aggregated based on the selected time range:
- ≤ 14 days → Unaggregated
- ≤ 90 days → Aggregated hourly
- > 90 days → Aggregated daily
View charts
- In the navigation menu, click Devices.
- Click the device name, then scroll down the page.
- Click the chevron icon to collapse the device details and focus on the chart.
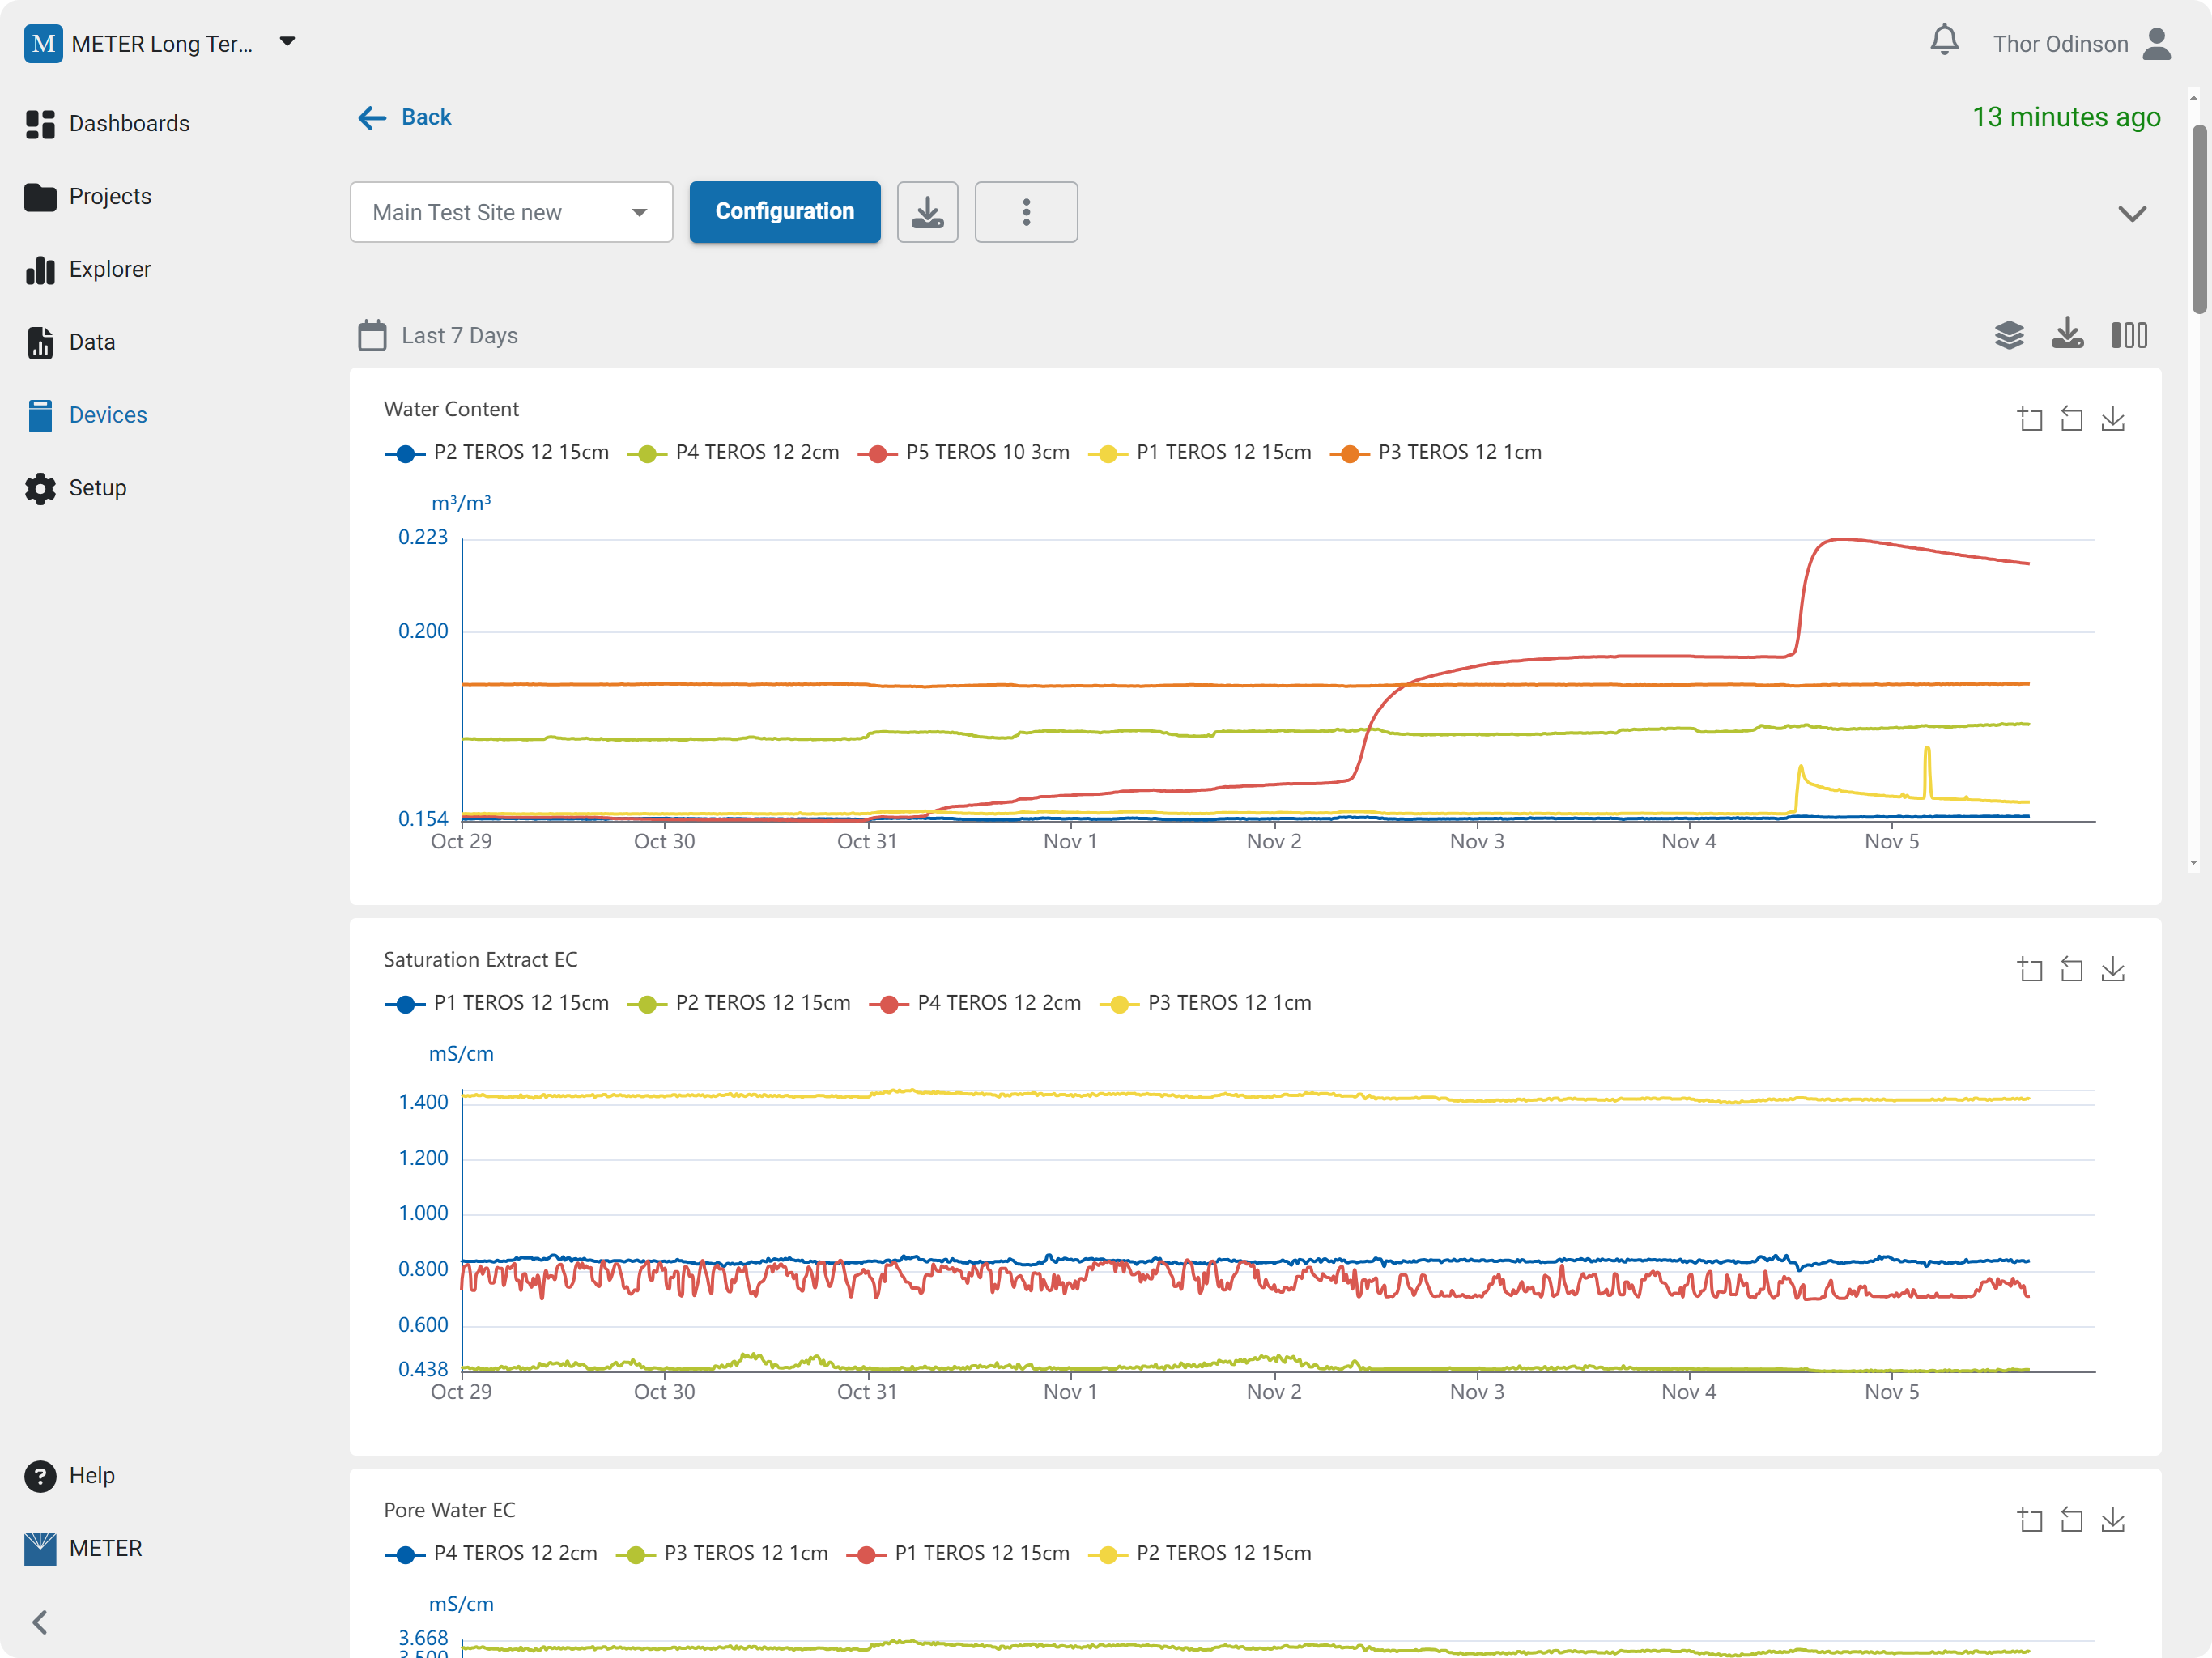
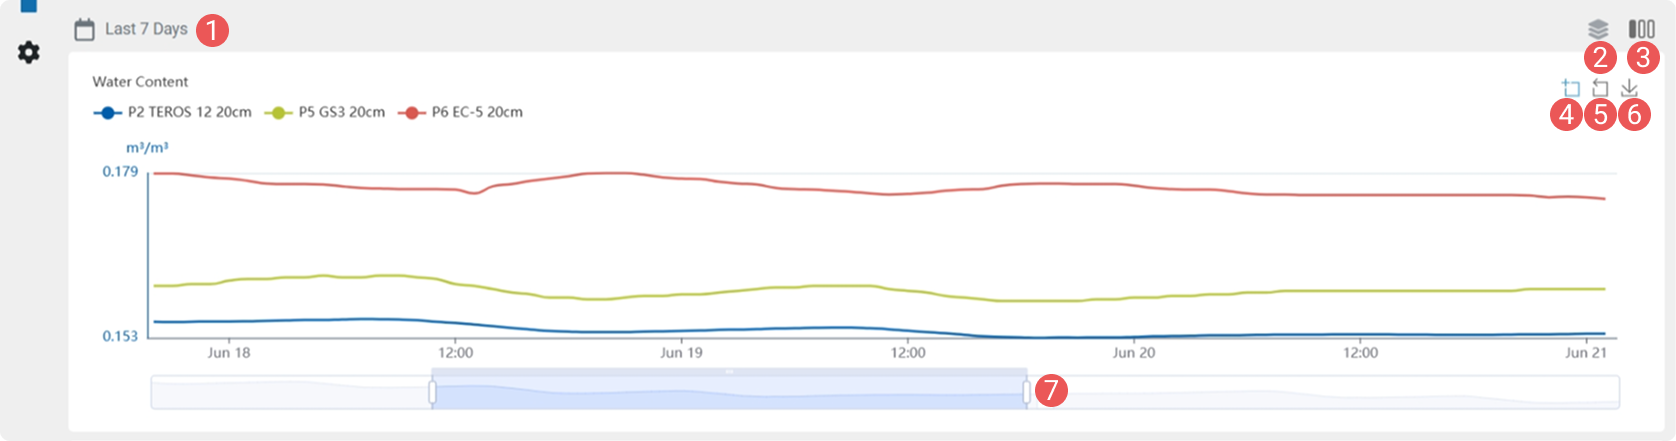
Chart controls
- Chart period
- Synchronize multi-chart cursor and zoom
- Chart width
- Chart zoom
- Zoom reset
- Save image
- Zoom select / drag
How-To-Video
How did we do?
Download Data
Data Logger Map