Table of Contents
Wet Bulb Globe Temperature (WBGT)
How to create a Wet Bulb Globe Temperature data stream.
Table of Contents
Wet Bulb Globe Temperature (WBGT) assesses the risk level of outdoor activities under heat stress. The stress thresholds let you track when heat stress will be experienced and help determine the duration and intensity of outdoor activities. WBGT thresholds are region-dependent.
WBGT thresholds by region (°F)
Color | Risk | Region 1 | Region 2 | Region 3 |
Black | Extreme | > 84.0 | > 87.6 | > 90 |
Red | High | 80.2 – 84.0 | 83.8 – 87.6 | 86.1 – 90.0 |
Orange | Moderate | 76.2 – 80.1 | 78.8 – 83.7 | 82.1 – 86.0 |
Yellow | Elevated | 72.3 – 76.1 | 75.9 – 78.7 | 78.3 – 82.0 |
Green | Low | < 72.3 | < 75.9 | < 78.3 |
WBGT thresholds by region (°C)
Color | Risk | Region 1 | Region 2 | Region 3 |
Black | Extreme | > 28.9 | > 30.9 | > 32.2 |
Red | High | 26.8 – 28.9 | 28.8 – 30.9 | 30.1 – 32.2 |
Orange | Moderate | 24.6 – 26.7 | 26.0 – 28.7 | 27.8 – 30.0 |
Yellow | Elevated | 22.4 – 24.5 | 24.4 – 25.9 | 25.7 – 27.8 |
Green | Low | < 22.4 | < 24.4 | < 25.7 |
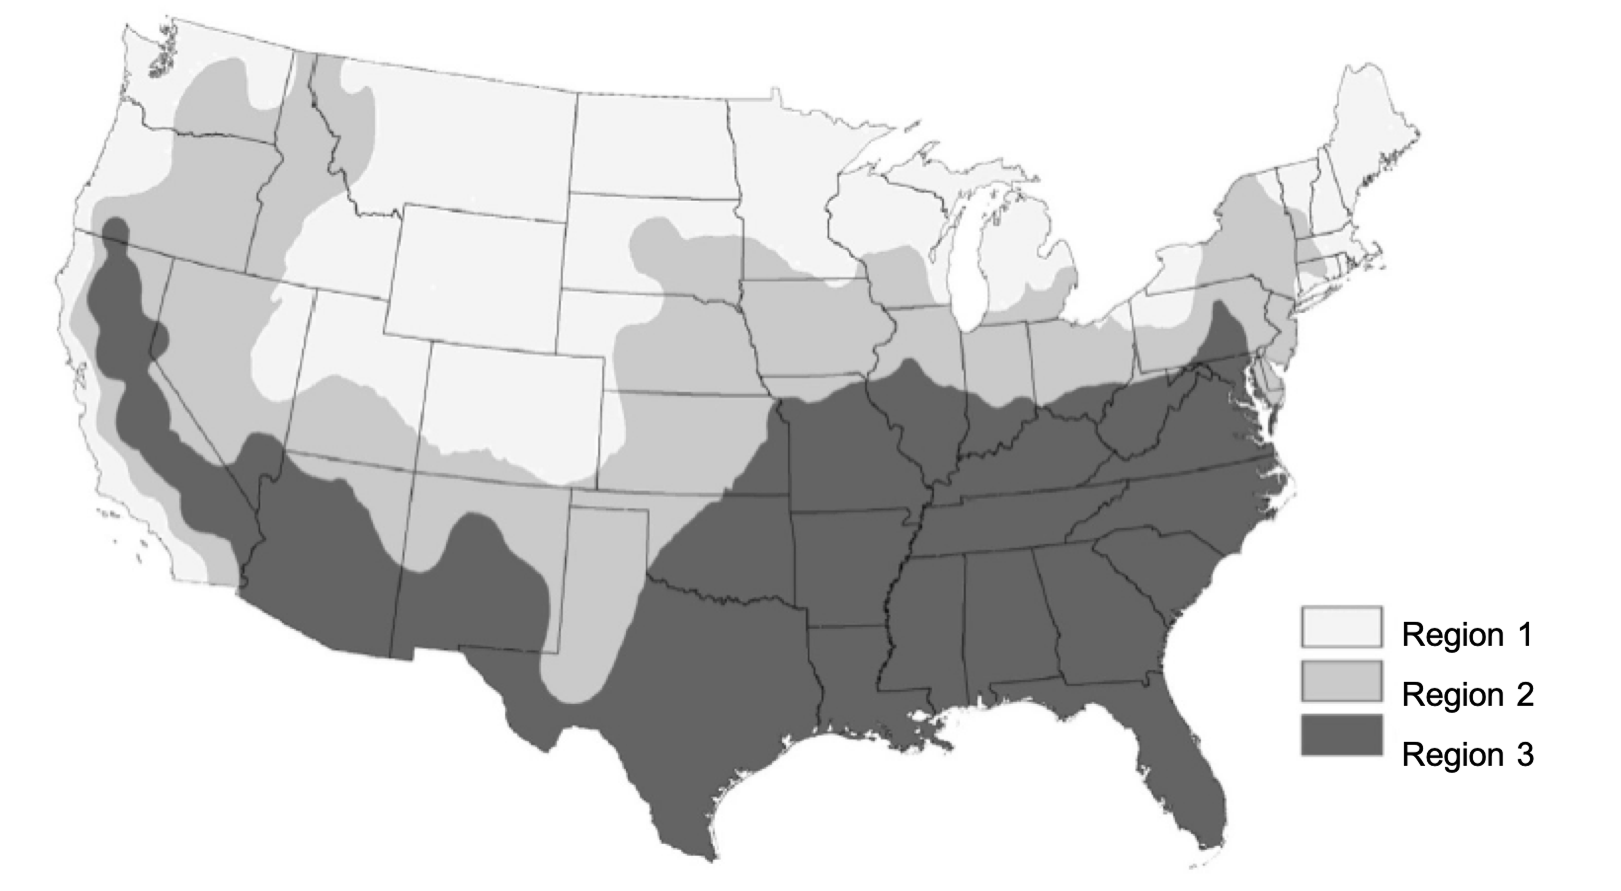
Region map (source: NOAA)
Related Heat Index thresholds
Color | Classification | Heat Index °F | Heat Index °C |
Red | Extreme Danger | > 125 | > 54 |
Orange | Danger | 103 – 124 | 41 – 54 |
Yellow | Extreme Caution | 90 – 103 | 32 – 41 |
Light Yellow | Caution | 80 – 90 | 27 – 32 |
Green | Comfortable | < 80 | < 27 |
Supported sensors
Wet Bulb Globe Temperature can be calculated from any ATMOS 41 sensor.
Recommended sensors
- ATMOS 41
- ATMOS 41W
Create a WBGT model
- On the Data page, select New Data.
- Select Wet Bulb Globe Temperature WBGT as the type.
- Select one or more ATMOS 41 data sources.
- Edit the data stream color.
- Edit the data stream name.
- Select Create to finish.
The new data stream(s) will now appear in your data list.
How did we do?